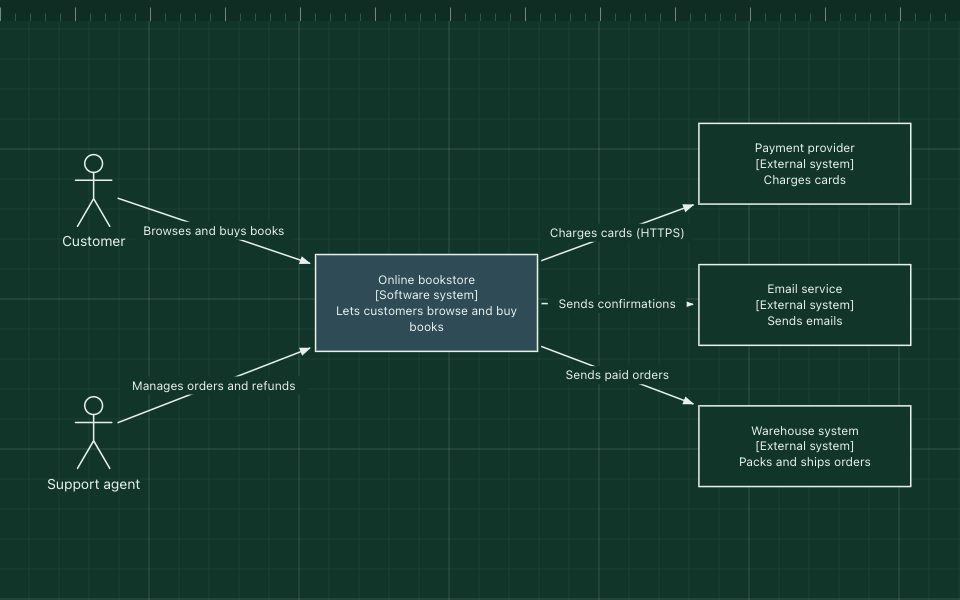
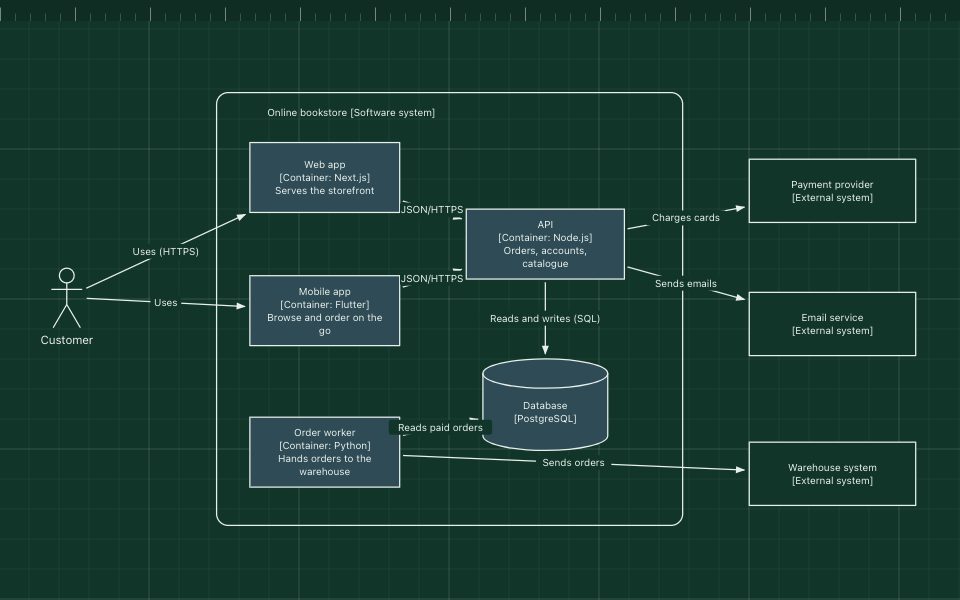
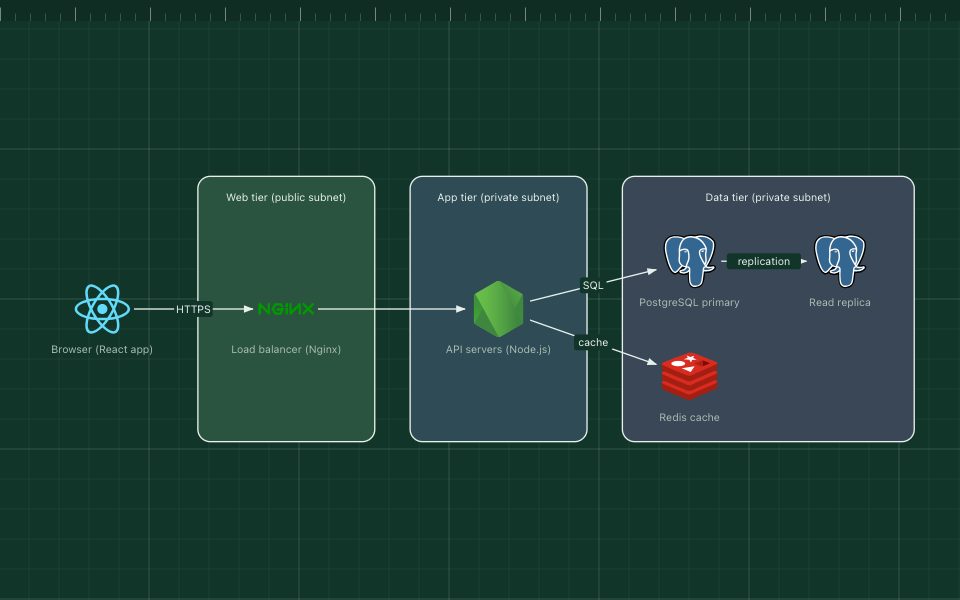
C4 component diagram
The component diagram is level 3 of the C4 model. It zooms into a single container and shows its main components: groups of related code behind a clear interface, such as controllers, services, repositories and clients for external systems.
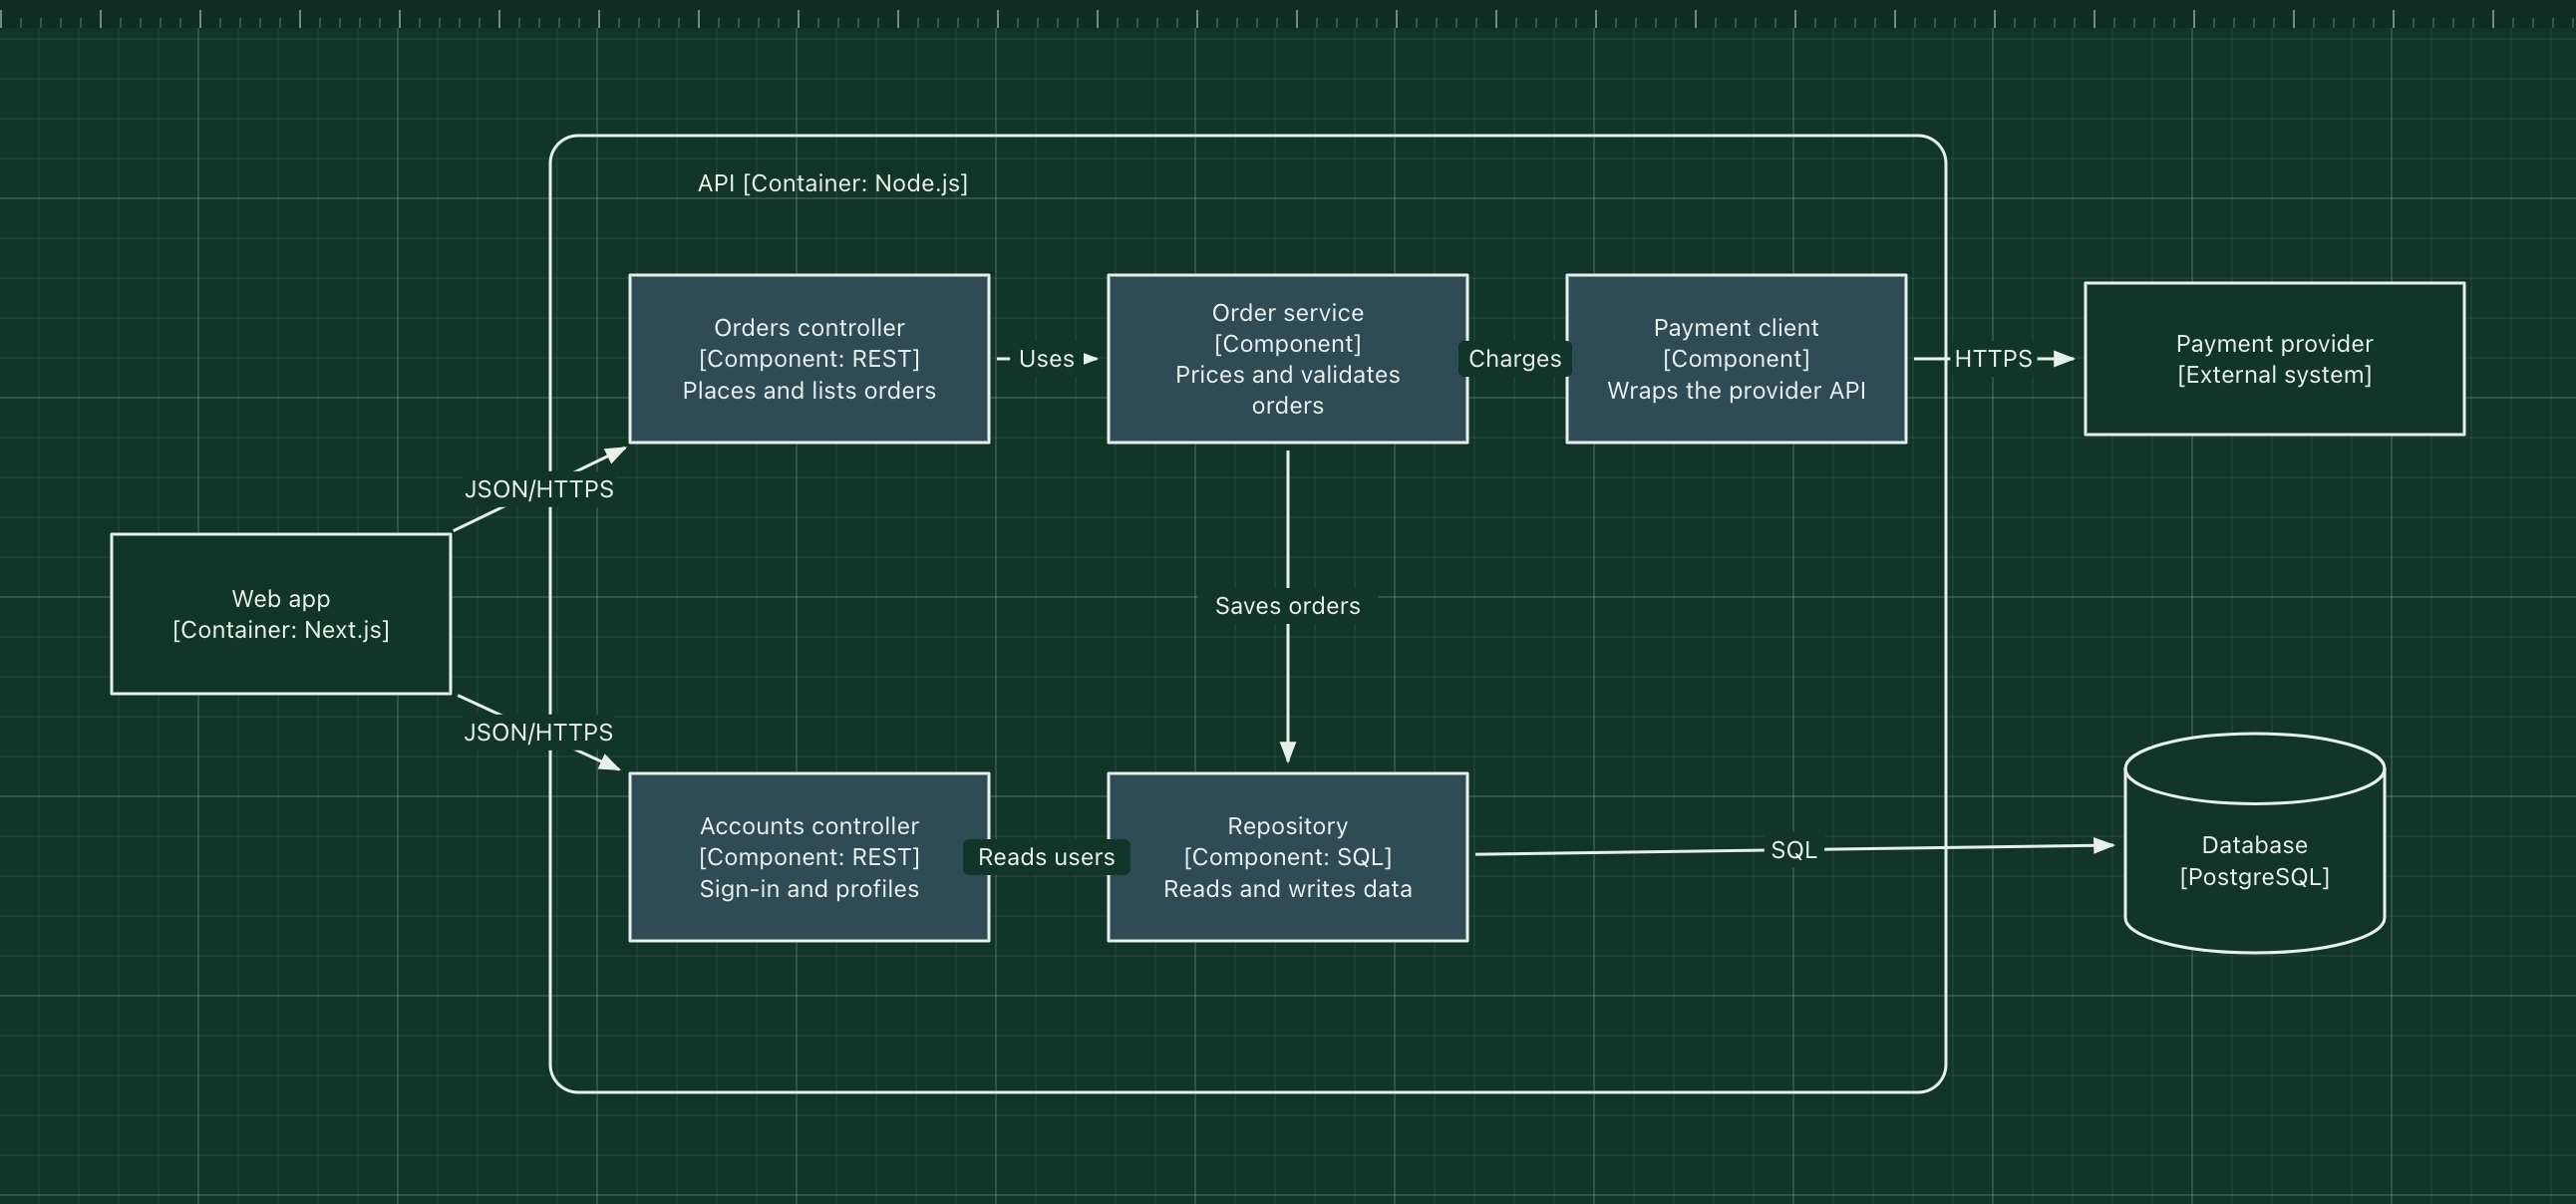
This template opens up the API container from the bookstore example. It is the level where architecture meets code structure, so it is worth drawing only for containers that are large or changing a lot.
What's in the diagram
- Container boundary
- Everything inside the box runs in the API process.
- Orders and Accounts controllers
- Handle HTTP requests from the web app and translate them into calls to the services.
- Order service
- The business rules: pricing, validation and the order life cycle.
- Payment client
- Hides the payment provider's API behind a small interface, so the provider can change.
- Repository
- The only component that talks to the database.
- Outside the container
- The web app, the database and the payment provider, shown for context.
How a request flows through it
- The web app sends "place order" to the orders controller.
- The controller validates the request and calls the order service.
- The order service prices the order and charges the card through the payment client.
- It saves the order through the repository, which writes to PostgreSQL.
- Sign-in and profile requests go through the accounts controller to the same repository.
When to use this architecture
Draw component diagrams sparingly: for a container that new developers struggle to navigate, before a big refactor, or to agree on boundaries inside a modular monolith. They go stale faster than higher levels, so keep them close to the code and update them in the same pull requests.
Ways to adapt the template
- Name components the way they are named in the code.
- Show the main flow only; leave helpers and utilities out.
- Use one component diagram per container, never one for the whole system.
- For level 4 (code), generate class diagrams from the code instead of drawing them.
How to customise this diagram
- Open your copy. Click Open in the editor. The template opens as your own project, saved in your browser. Nothing is uploaded.
- Rename the parts. Double-click any label, such as “API [Container: Node.js]”, type your own name, then click outside it. Arrow labels work the same way.
- Add a technology. Search the icon palette on the left, drag an icon onto the board, and connect it by dragging its arrow handle onto another component.
- Add what is missing. Drag more icons or shapes onto the board. Shapes include databases, servers, users, queues, mail, alerts and scheduled jobs.
- Adjust the zones. Zones are rounded rectangles with a fill colour. Resize them to fit, pick another colour from the selection bar, and press [ to send a zone behind the components.
- Export or share. Save the diagram as a PNG with the camera button, download the project as JSON with Export, or copy a link with Share.