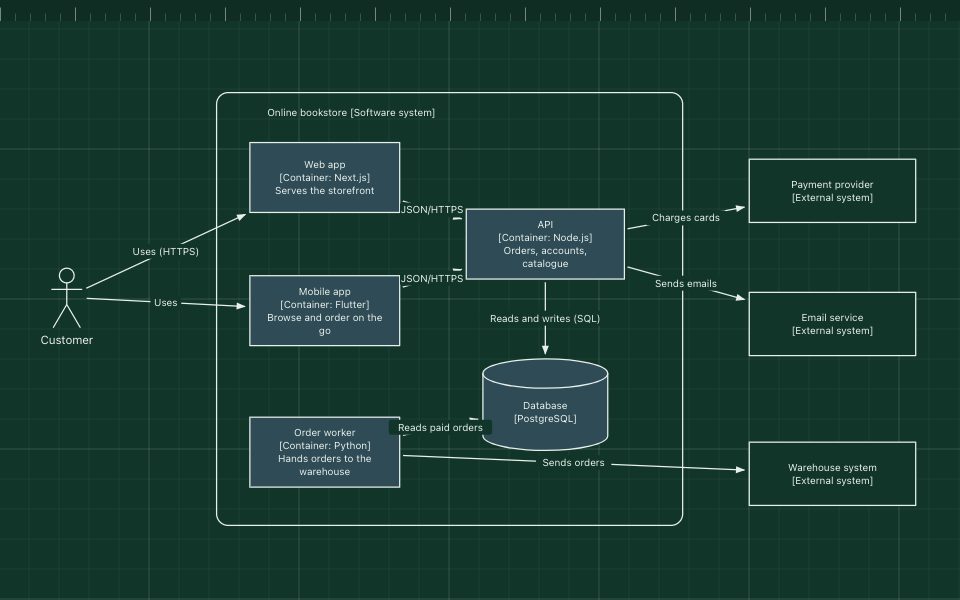
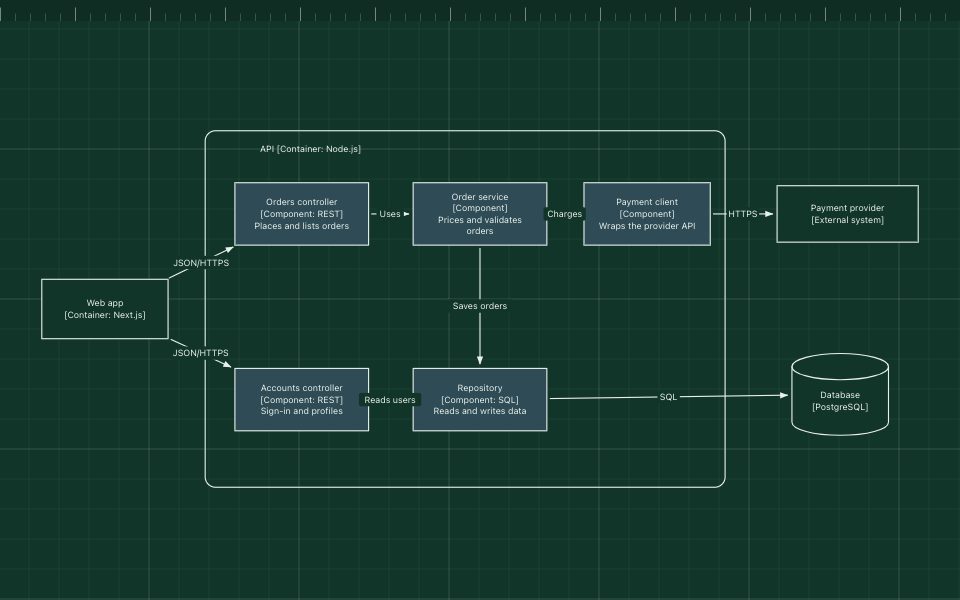
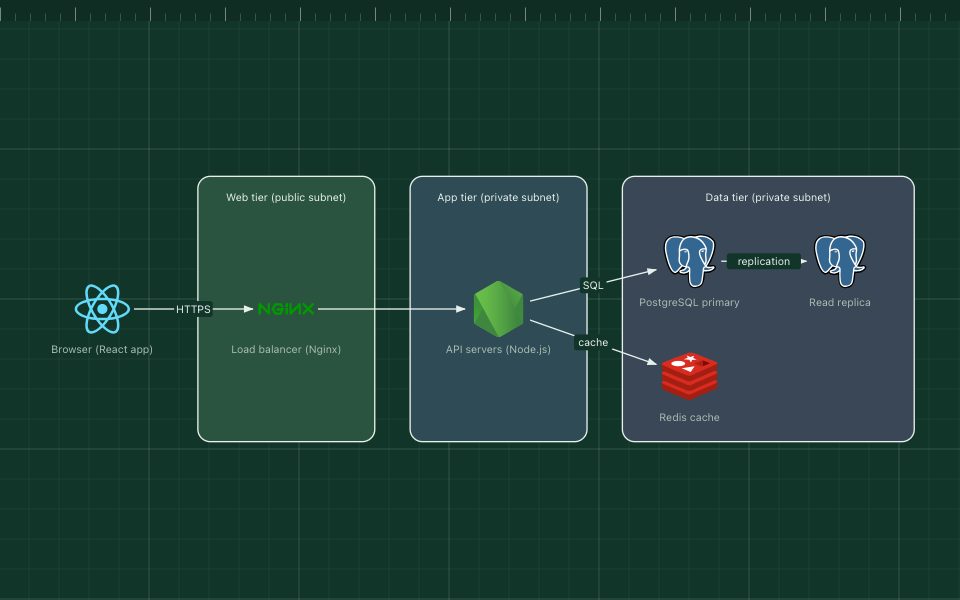
C4 system context diagram
The system context diagram is the first and most zoomed-out level of the C4 model. It shows one software system as a single box, the people who use it, and the other systems it talks to, and nothing about how it is built inside.
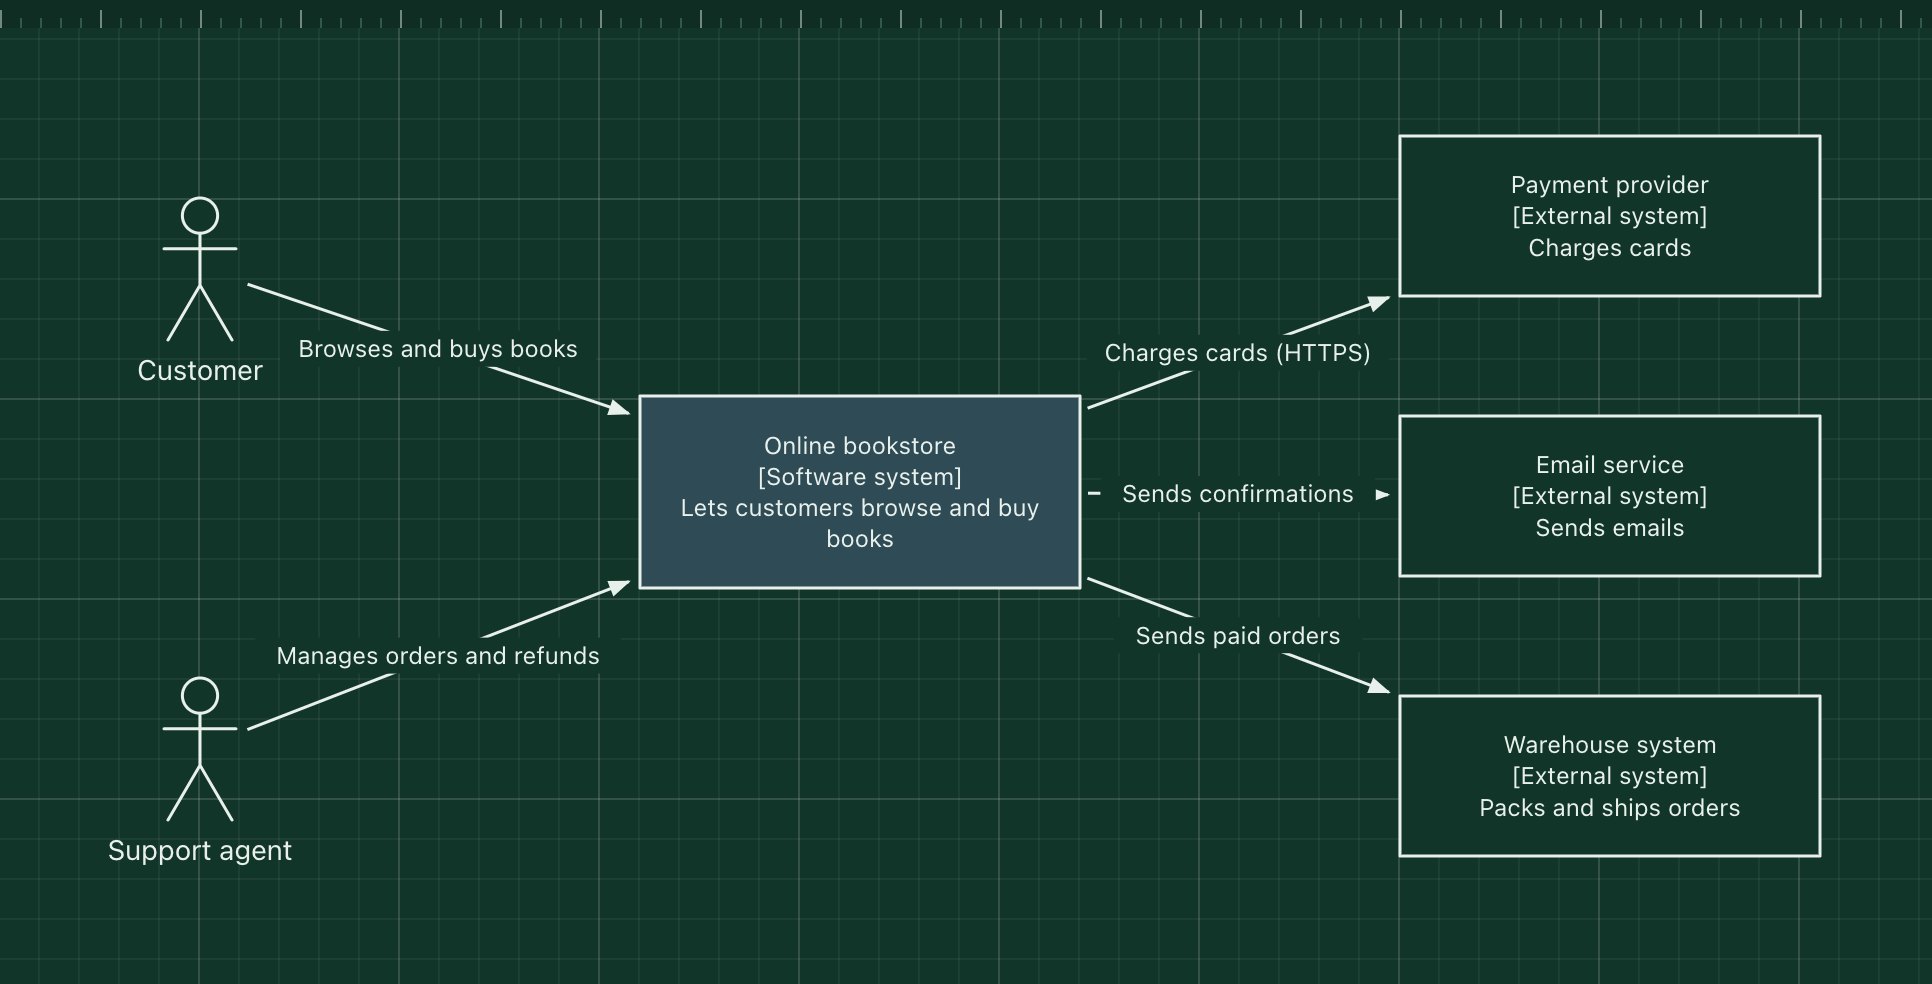
This template uses an online bookstore as the example. It is the diagram to put at the top of a README or a design document, because anyone, technical or not, can read it in a few seconds.
What's in the diagram
- Online bookstore
- The software system in scope, highlighted so it stands out from its neighbours.
- Customer and Support agent
- The people who use the system, each with a different goal.
- Payment provider
- An external system the bookstore depends on but does not own.
- Email service
- Sends order confirmations and password resets on the bookstore's behalf.
- Warehouse system
- Owned by another team or company; receives paid orders to pack and ship.
- Relationships
- Every arrow is labelled with what happens, and the protocol where it helps.
How a request flows through it
- A customer browses the catalogue and places an order in the bookstore.
- The bookstore asks the payment provider to charge the customer's card.
- Once paid, it sends a confirmation through the email service.
- It passes the order to the warehouse system for shipping.
- A support agent uses the bookstore to follow up on orders and issue refunds.
When to use this architecture
Draw a system context diagram for every system you own. It is the cheapest diagram to make and the one most people need: new joiners, product managers, security reviews and other teams. When you need to show what runs inside the system, zoom in with the container template.
Ways to adapt the template
- Replace the bookstore with your own system and list the people and systems around it.
- Group external systems by owner (other teams, vendors) with zones.
- Add a short key: what blue and plain boxes mean.
- Keep one system in scope per diagram; draw a separate one for a second system.
How to customise this diagram
- Open your copy. Click Open in the editor. The template opens as your own project, saved in your browser. Nothing is uploaded.
- Rename the parts. Double-click any label, such as “Customer”, type your own name, then click outside it. Arrow labels work the same way.
- Add a technology. Search the icon palette on the left, drag an icon onto the board, and connect it by dragging its arrow handle onto another component.
- Add what is missing. Drag more icons or shapes onto the board. Shapes include databases, servers, users, queues, mail, alerts and scheduled jobs.
- Group related parts. Draw a rounded rectangle around related components, give it a fill colour from the selection bar, and press [ to send it behind them.
- Export or share. Save the diagram as a PNG with the camera button, download the project as JSON with Export, or copy a link with Share.