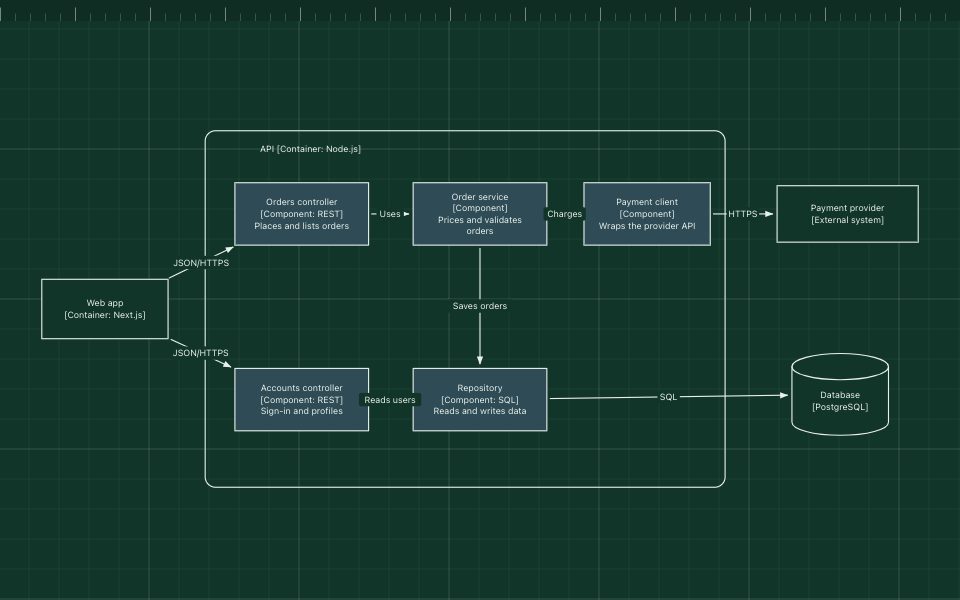
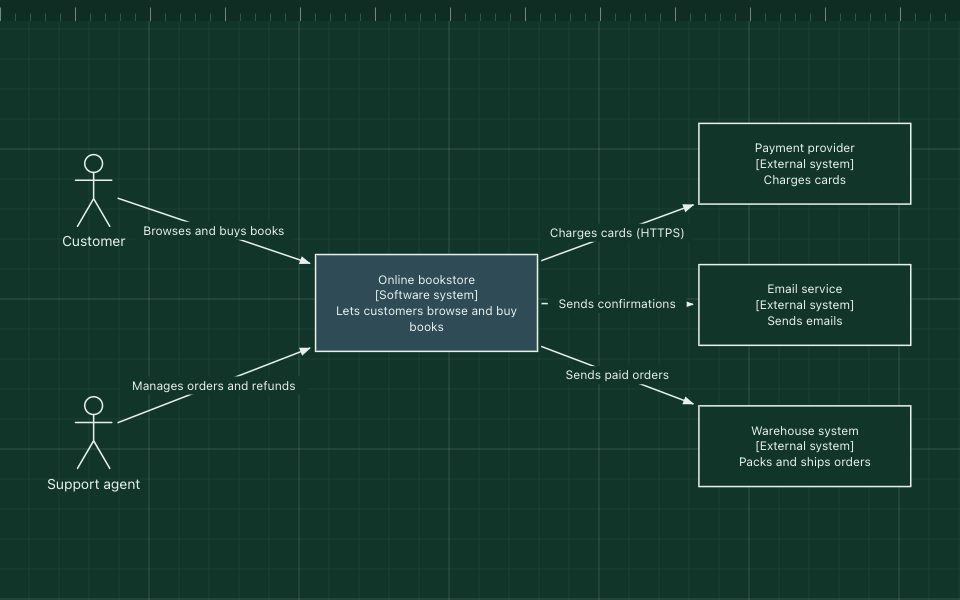
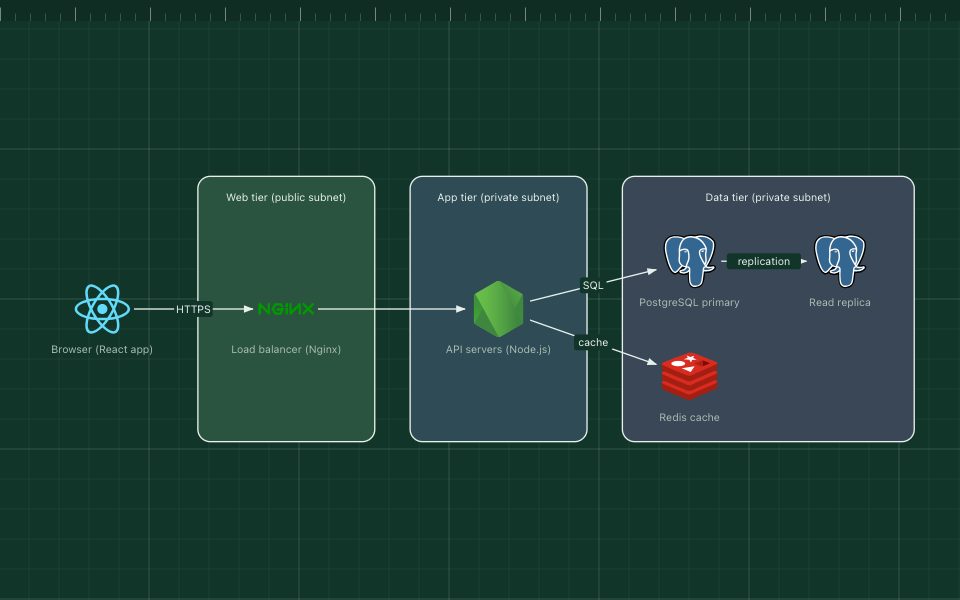
C4 container diagram
The container diagram is level 2 of the C4 model. It zooms into one software system and shows its containers: the separately running applications and data stores, such as a web app, an API, a database or a background worker. A C4 container is not a Docker container, although it often runs in one.
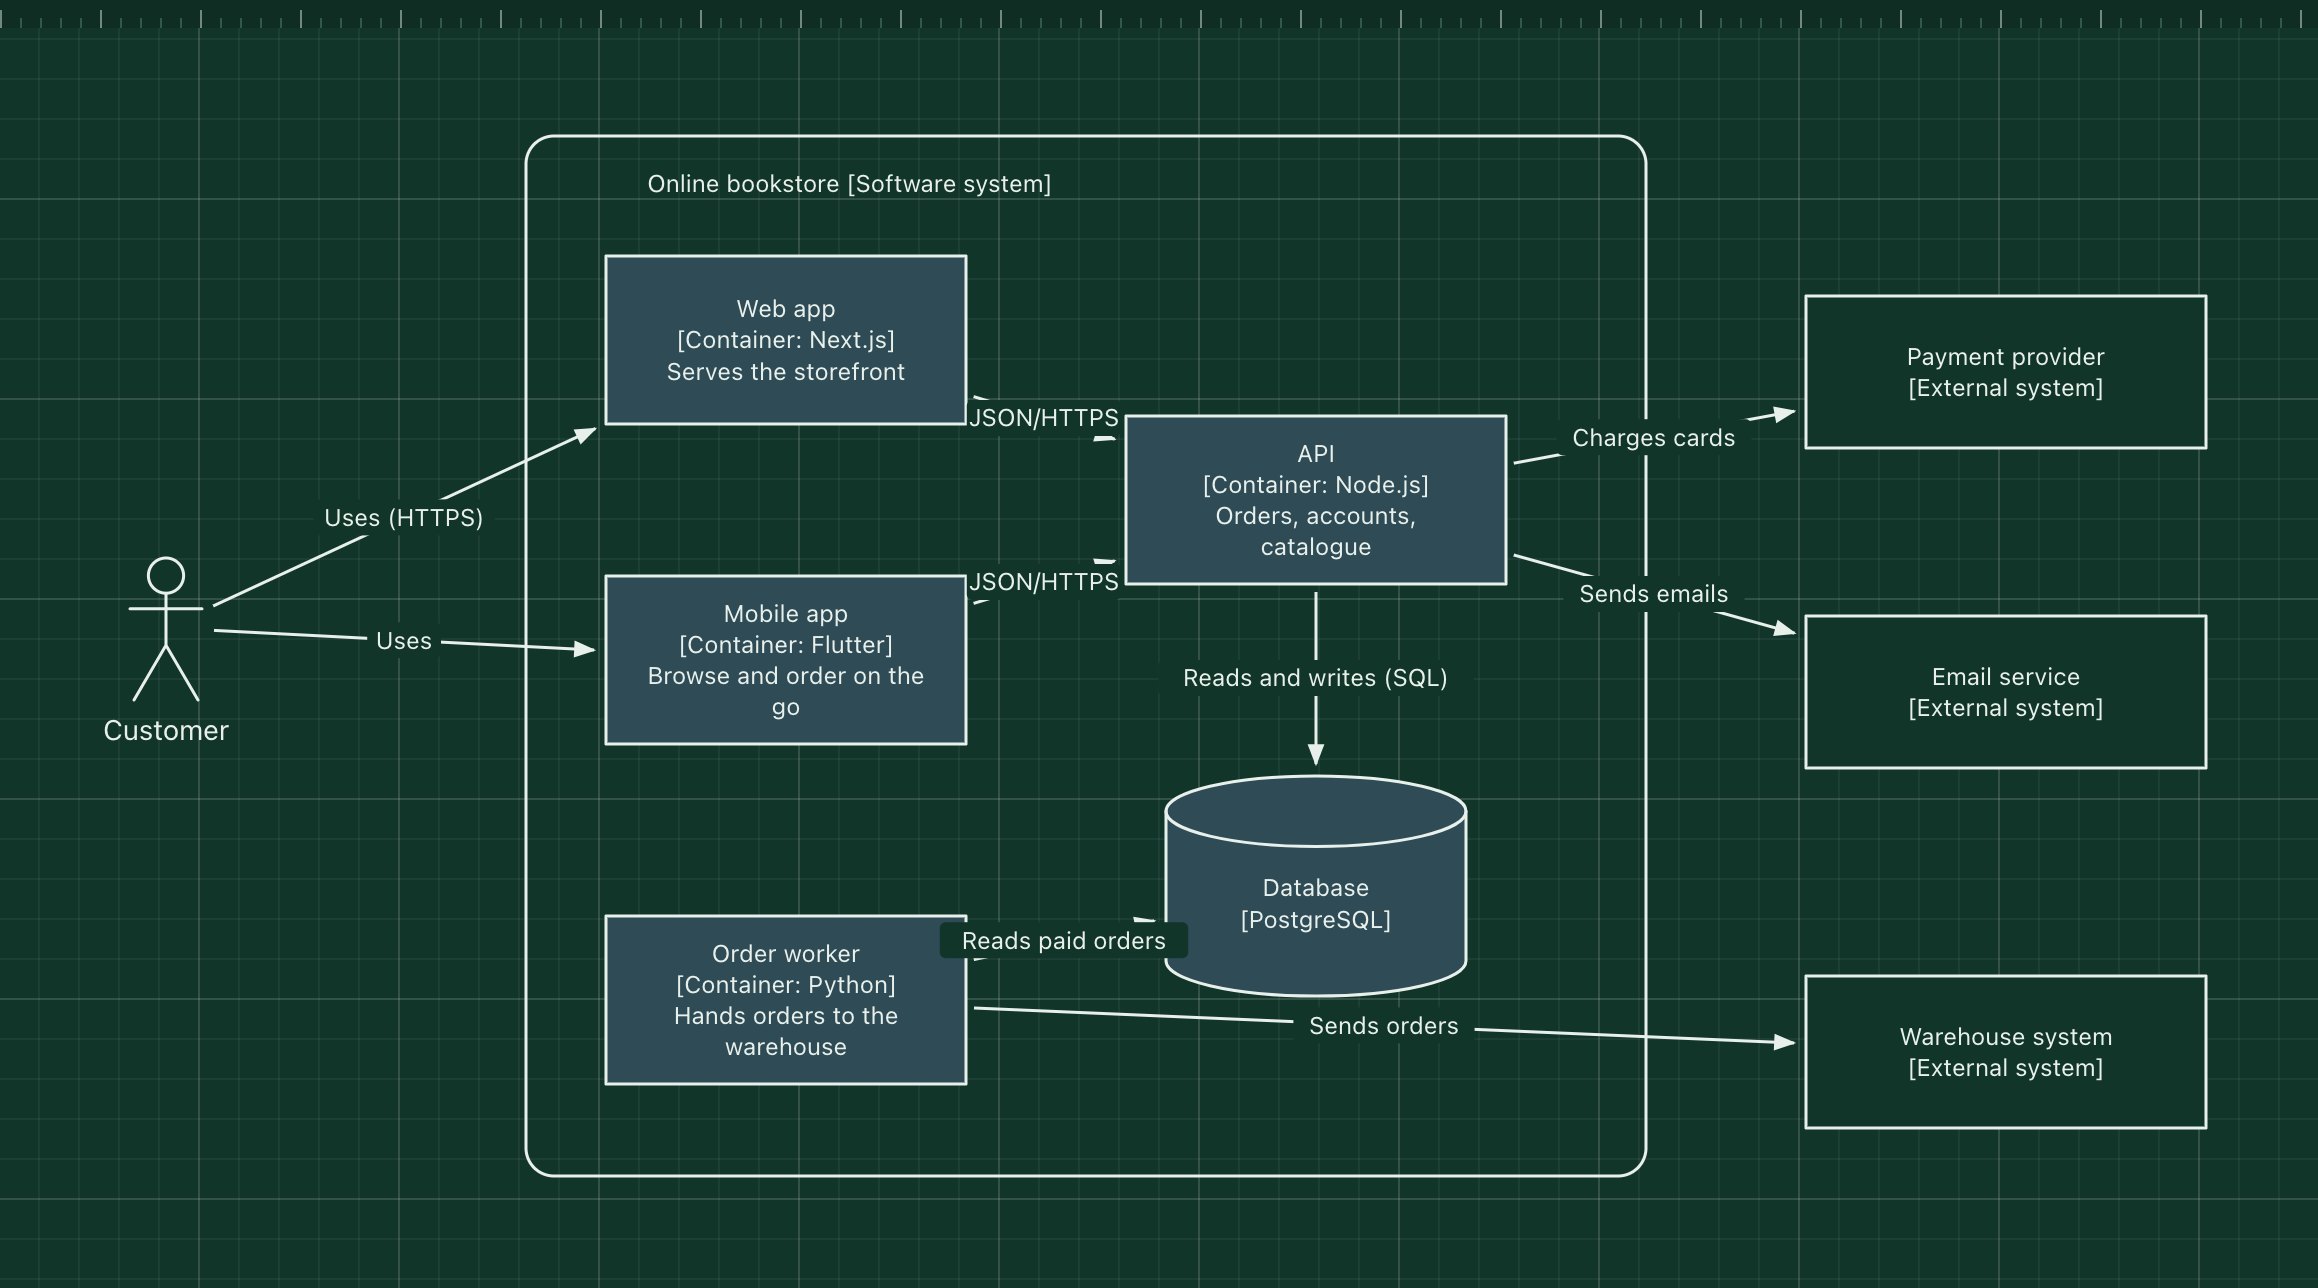
This template continues the bookstore example from the system context template, showing the technology of each container and how they talk to each other and to the outside world.
What's in the diagram
- System boundary
- The box around the containers marks what belongs to the bookstore.
- Web app and Mobile app
- The two ways customers reach the system, each with its technology in brackets.
- API
- The single backend both apps call, holding the business logic.
- Database
- PostgreSQL, owned by the API and read by the order worker.
- Order worker
- A background process that hands paid orders to the warehouse.
- External systems
- The same neighbours as in the context diagram, now connected to the container that calls them.
How a request flows through it
- A customer opens the web or mobile app.
- The app calls the API over HTTPS with JSON.
- The API reads and writes the database and charges the card through the payment provider.
- It sends the confirmation email through the email service.
- The order worker picks up paid orders from the database and sends them to the warehouse system.
When to use this architecture
Draw a container diagram when people need to know what to deploy, where the data lives and which technology each part uses: onboarding, operations, security reviews and capacity planning. It is usually the most useful C4 level for engineering teams. Zoom further with the component template only where a container is complex.
Ways to adapt the template
- Write the technology of every container in brackets, as in "[Container: Go]".
- Add queues and caches as their own containers.
- Show deployment (regions, clusters) in a separate deployment diagram rather than here.
- Link each container box to its repository in your documentation.
How to customise this diagram
- Open your copy. Click Open in the editor. The template opens as your own project, saved in your browser. Nothing is uploaded.
- Rename the parts. Double-click any label, such as “Online bookstore [Software system]”, type your own name, then click outside it. Arrow labels work the same way.
- Add a technology. Search the icon palette on the left, drag an icon onto the board, and connect it by dragging its arrow handle onto another component.
- Add what is missing. Drag more icons or shapes onto the board. Shapes include databases, servers, users, queues, mail, alerts and scheduled jobs.
- Adjust the zones. Zones are rounded rectangles with a fill colour. Resize them to fit, pick another colour from the selection bar, and press [ to send a zone behind the components.
- Export or share. Save the diagram as a PNG with the camera button, download the project as JSON with Export, or copy a link with Share.