Kubernetes microservices architecture diagram
In a microservices architecture each business capability runs as its own service, with its own data, deployed and scaled on its own. Kubernetes schedules the containers, restarts them when they fail and routes traffic to them.
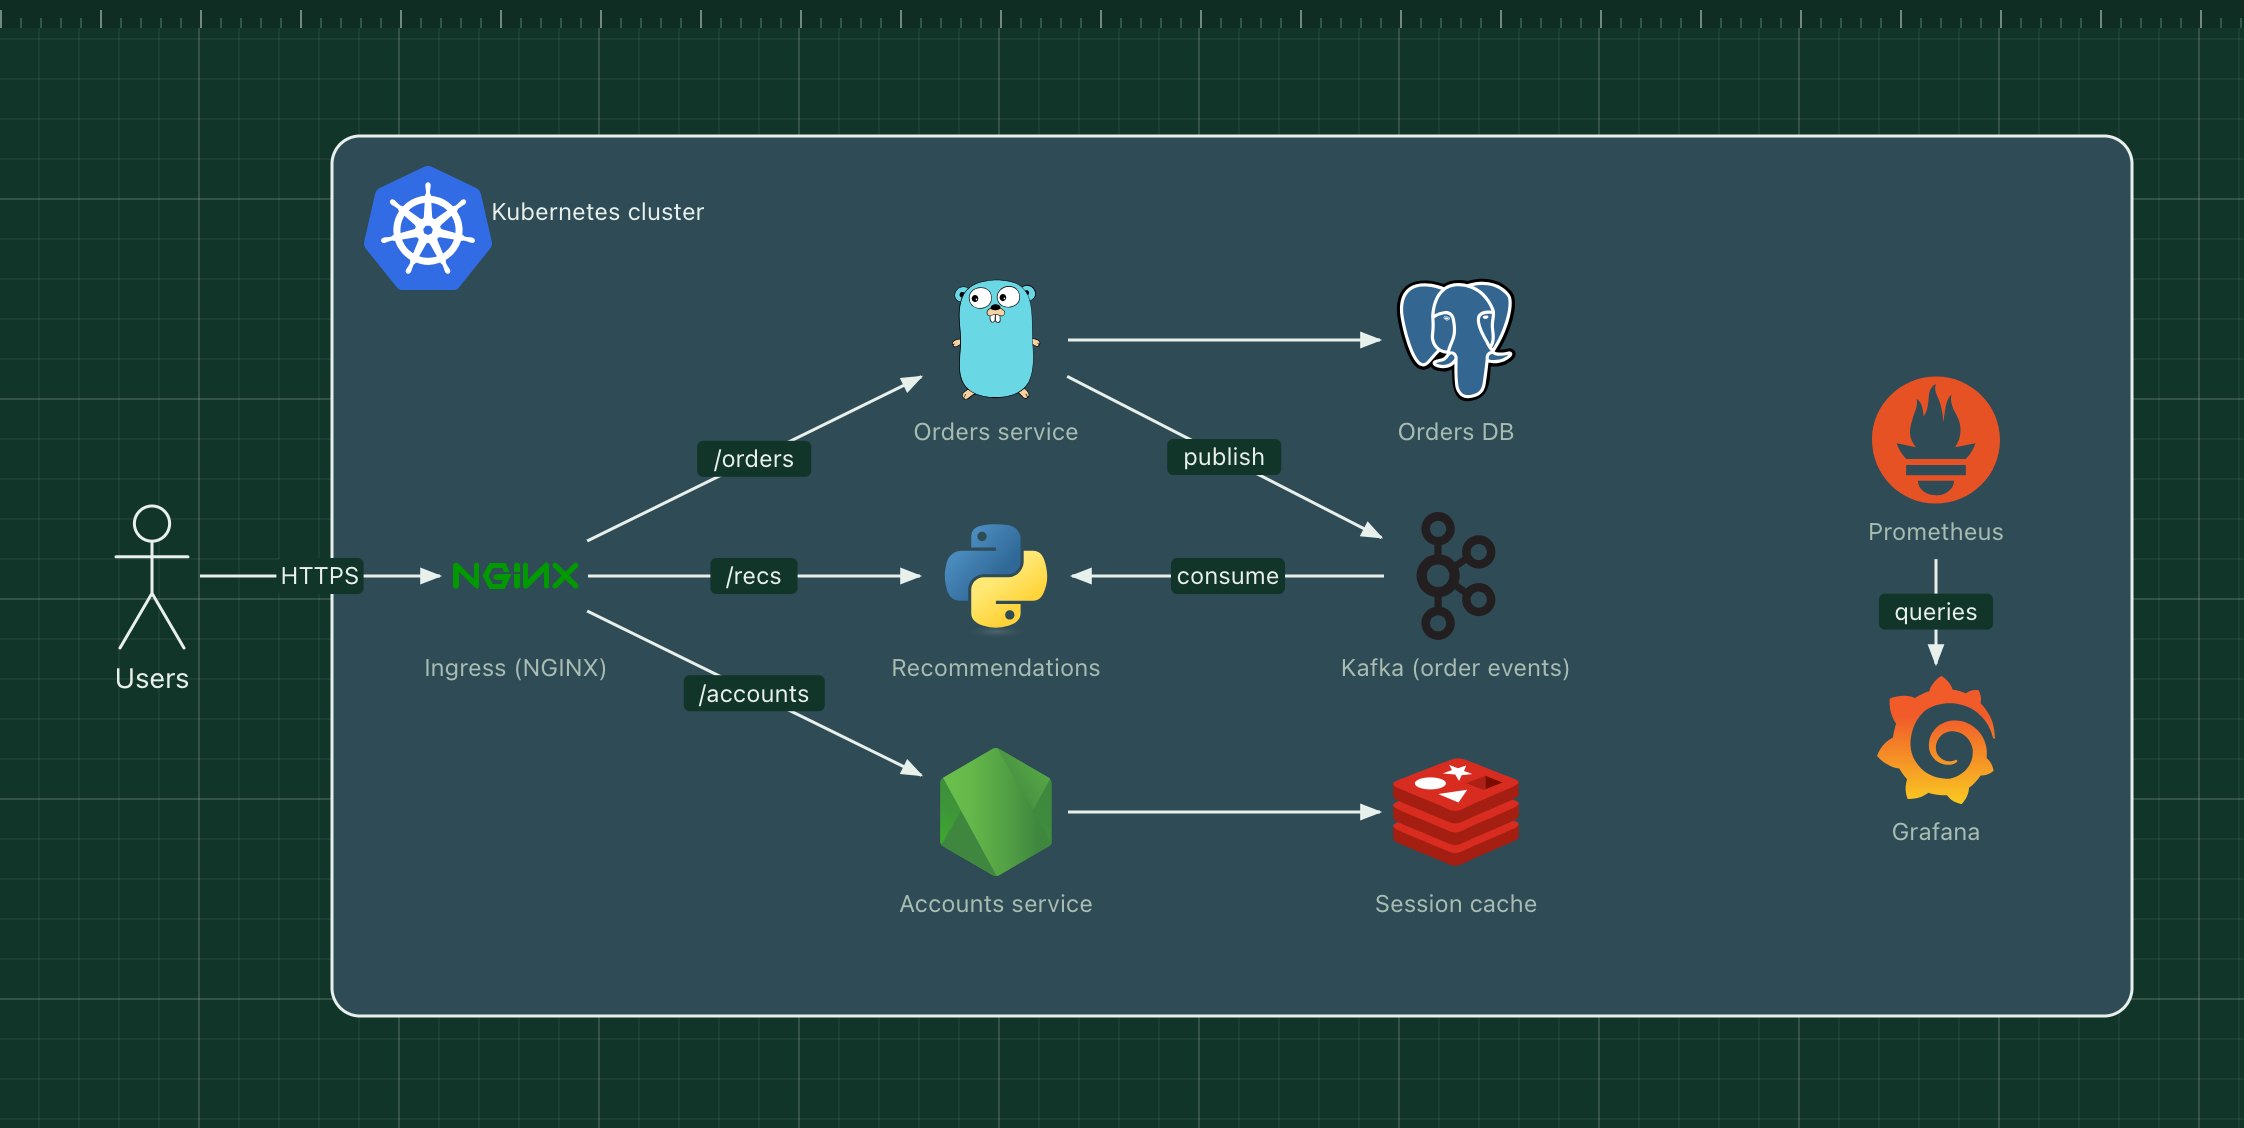
This template shows three services written in different languages behind one ingress, an event stream that decouples them, and a Prometheus and Grafana pair watching the whole cluster.
What's in the diagram
- Ingress (NGINX)
- The single entry point to the cluster. It routes requests to services by path: /orders, /recs, /accounts.
- Orders service (Go)
- Owns orders and the Orders database. After each order it publishes an event instead of calling other services directly.
- Recommendations (Python)
- Consumes order events from Kafka to update its model, and serves recommendations over HTTP.
- Accounts service (Node.js)
- Handles sign-in and profiles, with sessions in Redis.
- Kafka (order events)
- A durable log of events. Producers and consumers do not need to be up at the same time.
- Prometheus and Grafana
- Prometheus scrapes metrics from every pod; Grafana turns them into dashboards and alerts.
How a request flows through it
- A user request reaches the NGINX ingress over HTTPS.
- The ingress picks the service from the URL path and forwards the request to one of its pods.
- The Orders service writes the order to its own PostgreSQL database.
- It then publishes an "order placed" event to Kafka and returns.
- The Recommendations service consumes the event later, at its own pace.
When to use this architecture
Use it when several teams ship independently, when parts of the system have very different load, or when you need different languages for different jobs. For a single small team the three-tier template is usually cheaper to run and easier to debug.
Ways to adapt the template
- Add a service mesh such as Istio for mutual TLS and retries between services.
- Swap Kafka for RabbitMQ if you need work queues rather than an event log.
- Give each namespace its own zone to show team ownership.
- Add Argo CD to show how services are deployed (see the CI/CD template).
How to customise this diagram
- Open your copy. Click Open in the editor. The template opens as your own project, saved in your browser. Nothing is uploaded.
- Rename the parts. Double-click any label, such as “Ingress (NGINX)”, type your own name, then click outside it. Arrow labels work the same way.
- Swap a technology. Select Ingress (NGINX) and press Delete. Search the icon palette for the technology you use, drag it onto the board, and reconnect it by dragging its arrow handle onto the next component.
- Add what is missing. Drag more icons or shapes onto the board. Shapes include databases, servers, users, queues, mail, alerts and scheduled jobs.
- Adjust the zones. Zones are rounded rectangles with a fill colour. Resize them to fit, pick another colour from the selection bar, and press [ to send a zone behind the components.
- Export or share. Save the diagram as a PNG with the camera button, download the project as JSON with Export, or copy a link with Share.