Service mesh with Istio architecture diagram
A service mesh moves network concerns out of application code. Every pod gets a small proxy, a sidecar, and all traffic between services goes through those proxies, which handle encryption, retries, timeouts and metrics.
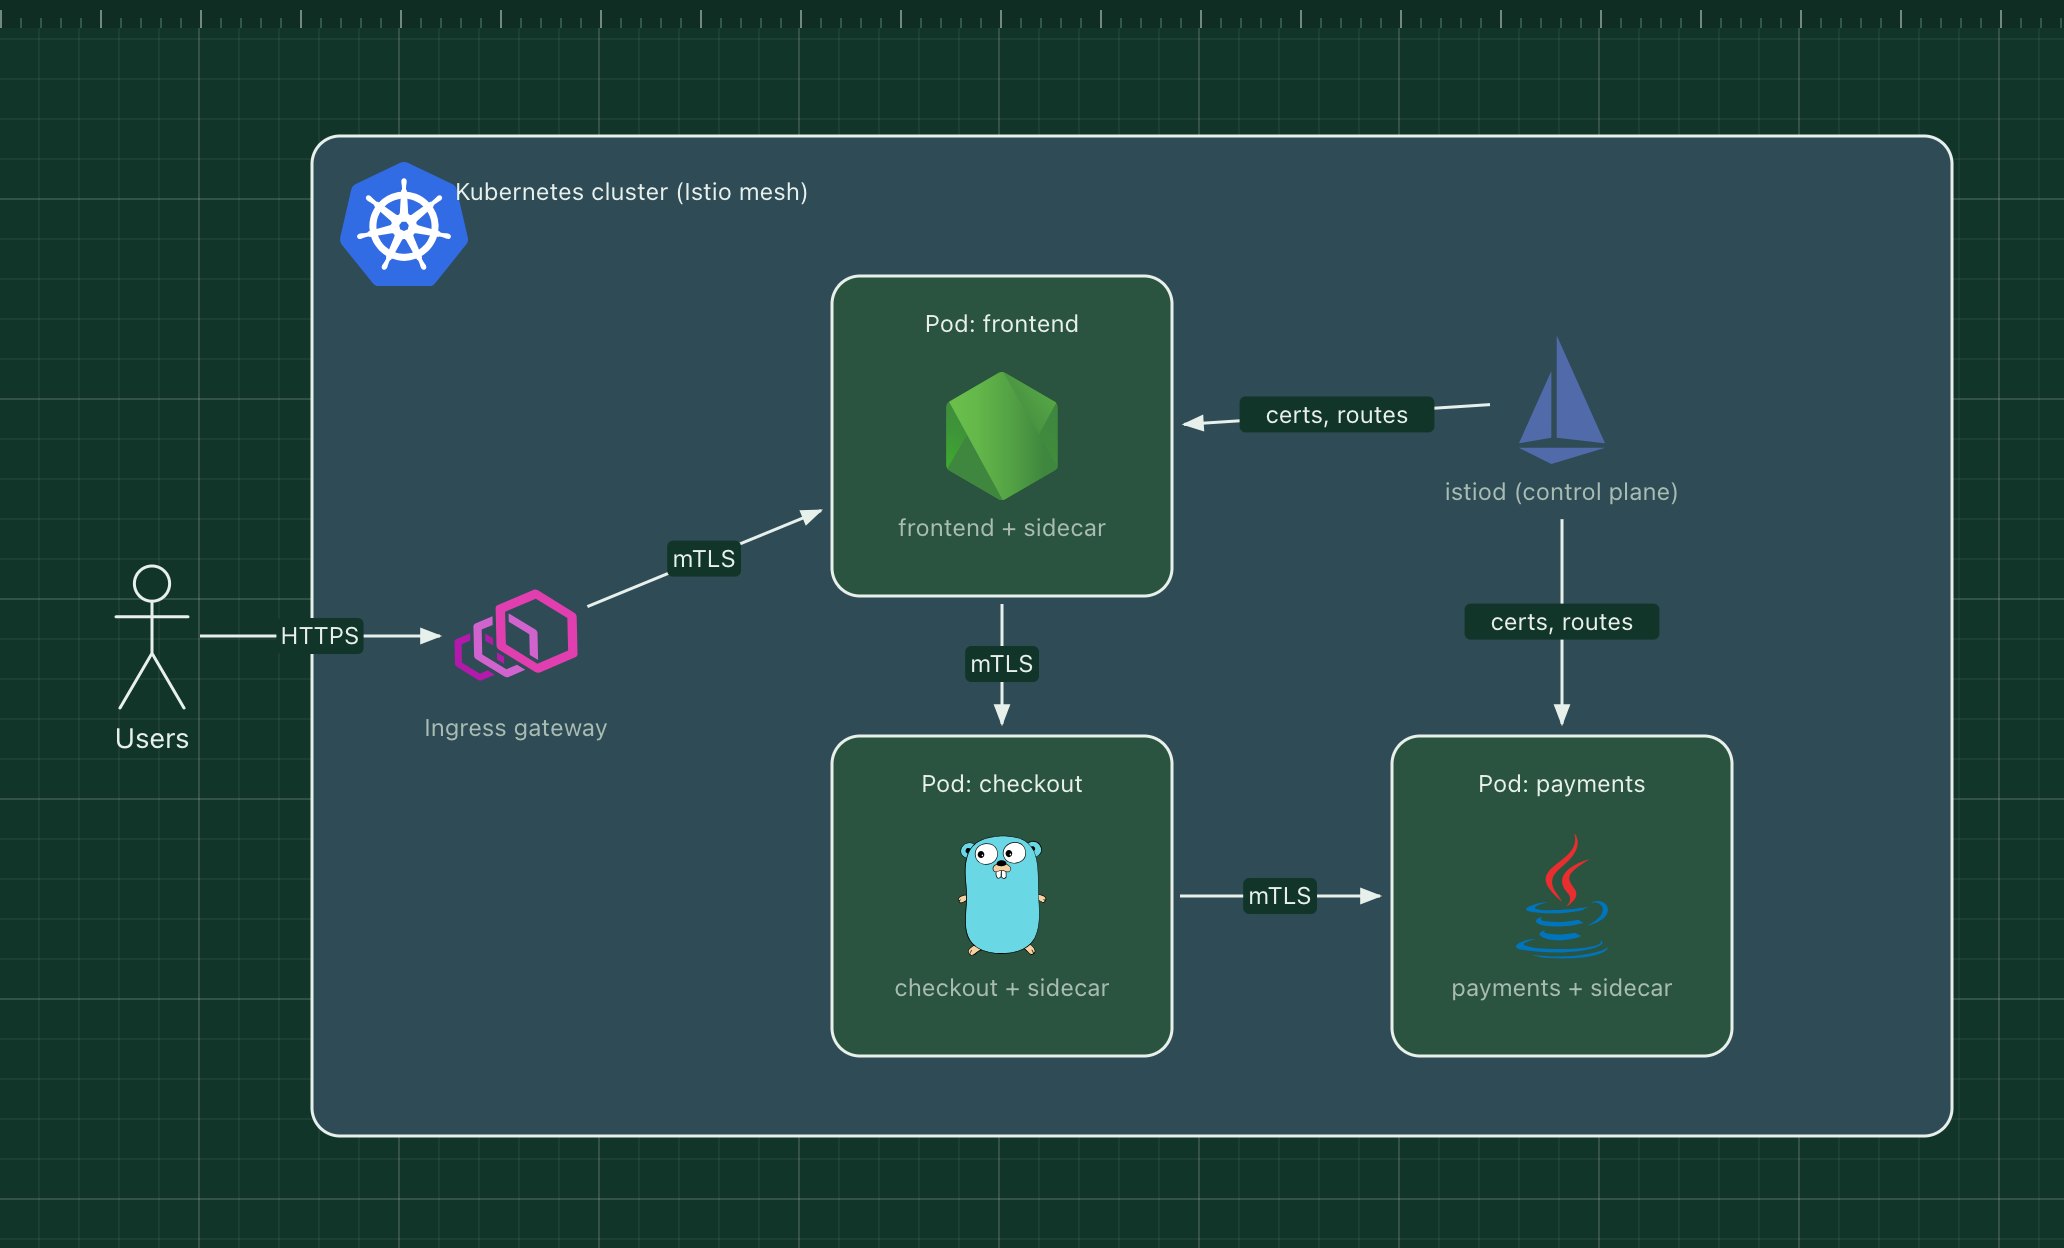
This template shows Istio on Kubernetes: Envoy proxies in each pod, an ingress gateway at the edge, and istiod, the control plane that configures every proxy and issues their certificates.
What's in the diagram
- Ingress gateway
- An Envoy proxy at the edge of the mesh that receives outside traffic and applies routing rules.
- Envoy sidecars
- Injected into each pod next to the application. The app talks plain HTTP to localhost; the sidecar handles the rest.
- Mutual TLS
- Sidecars encrypt traffic between pods and prove each service's identity to the other side.
- istiod
- Pushes routing rules and policies to every proxy and rotates their certificates automatically.
- Services
- frontend, checkout and payments, written in different languages, need no networking code of their own.
How a request flows through it
- A request enters through the ingress gateway, which routes it to the frontend pod.
- frontend calls checkout; its sidecar intercepts the call and opens a mutual TLS connection to checkout's sidecar.
- checkout's sidecar checks the caller's identity against the authorization policy, then passes the request to the app.
- checkout calls payments the same way; if payments is slow, the sidecar applies the configured timeout and retry.
- Every proxy reports metrics and traces, so the whole call chain is visible without touching the code.
When to use this architecture
Use it when you run many services and need consistent encryption, access policies and traffic control across teams and languages. A mesh adds moving parts and some latency; with a handful of services, a library or your platform's built-in features may be enough.
Ways to adapt the template
- Use Istio's ambient mode to drop per-pod sidecars in favour of node-level proxies.
- Add canary releases by splitting traffic by percentage between two versions.
- Connect Prometheus, Grafana and Kiali to see the service graph.
- Consider Linkerd for a smaller, simpler mesh.
How to customise this diagram
- Open your copy. Click Open in the editor. The template opens as your own project, saved in your browser. Nothing is uploaded.
- Rename the parts. Double-click any label, such as “Ingress gateway”, type your own name, then click outside it. Arrow labels work the same way.
- Swap a technology. Select Ingress gateway and press Delete. Search the icon palette for the technology you use, drag it onto the board, and reconnect it by dragging its arrow handle onto the next component.
- Add what is missing. Drag more icons or shapes onto the board. Shapes include databases, servers, users, queues, mail, alerts and scheduled jobs.
- Adjust the zones. Zones are rounded rectangles with a fill colour. Resize them to fit, pick another colour from the selection bar, and press [ to send a zone behind the components.
- Export or share. Save the diagram as a PNG with the camera button, download the project as JSON with Export, or copy a link with Share.