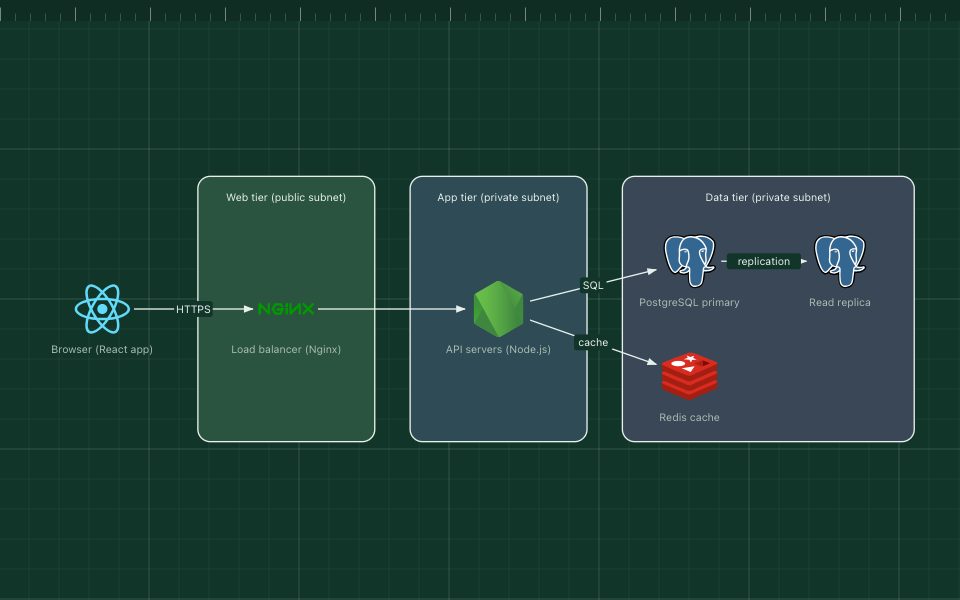
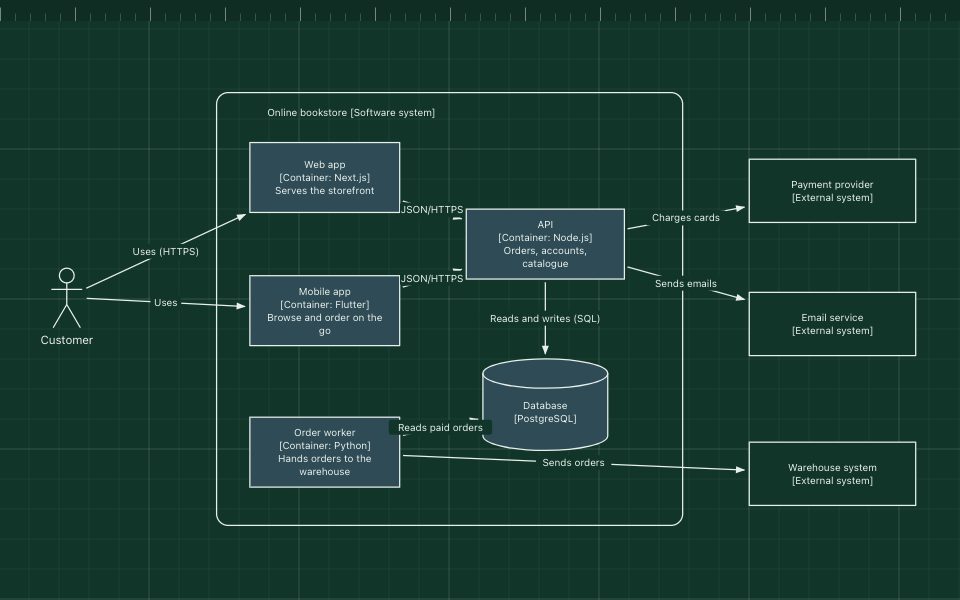
How to draw a software architecture diagram
A practical, step-by-step method for diagrams that answer one question clearly.
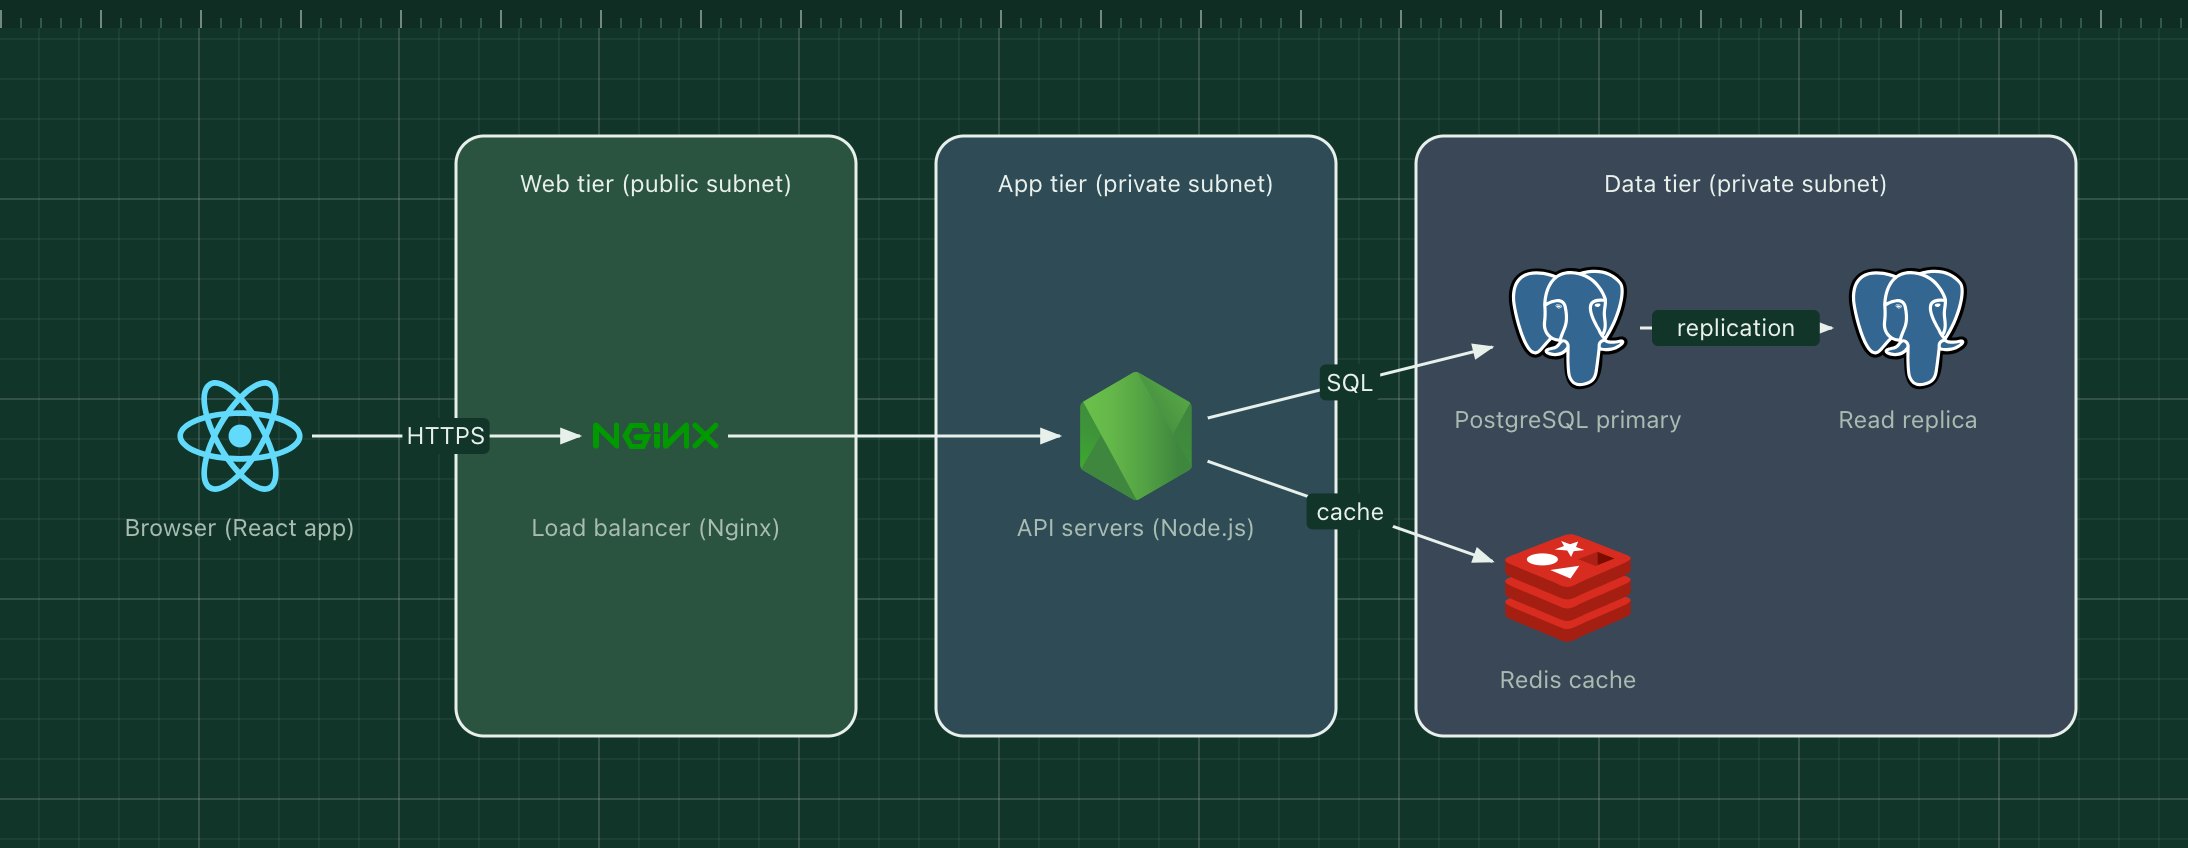
Most architecture diagrams fail for the same reason: they try to show everything at once. A good one answers a single question for a specific reader, and leaves the rest for another diagram.
This guide walks through a method that works for anything from a three-tier web app to a fleet of microservices. Each step takes a few minutes, and you can follow along in the ArchBoard editor.
1. Decide who it is for and what it answers#
Before drawing a box, write down two things:
- The reader. A new engineer, a security reviewer, a product manager, an on-call engineer at 3 a.m.
- The question. "What talks to what?", "Where does customer data live?", "What happens when a user places an order?"
The reader decides the level of detail and the vocabulary. The question decides what is in and what is out. If you cannot write the question in one sentence, you probably need two diagrams.
2. Pick one level of detail#
Mixing levels is the most common source of confusing diagrams: a box for "the payment provider" next to a box for "the OrderRepository class". Pick one level and stay there:
| Level | Shows | Typical reader |
|---|---|---|
| System context | Your system as one box, its users and the systems around it | Everyone |
| Containers | The apps, services and data stores inside your system | Engineers, operations |
| Components | The main parts inside one service | Developers of that service |
| Deployment | Where things run: regions, clusters, machines | Operations, security |
These levels come from the C4 model, which is worth knowing even if you never draw "official" C4 diagrams.
3. Start from the main request path#
Begin where a request enters the system and follow it to where the data ends up. For a web product that is usually the user, then the browser or app, the edge (CDN, load balancer), the backend and the databases.
Drawing the happy path first gives the diagram a direction, usually left to right, that the reader can follow without instructions. Add side paths, such as background jobs, caches and third-party APIs, only once the main path reads well.
4. Make every box say what it is#
Each box needs two pieces of information: what it does and what it is built with. "Orders API (Go)" tells the reader far more than "Service A" or a lone logo.
- Use the names people use in conversation and in the code.
- Add the technology, either as an icon or in brackets.
- Use the same shape for the same kind of thing: every database a cylinder, every person a stick figure.
Real technology icons help here, because readers recognise PostgreSQL or Kafka instantly. They are a shortcut, not a substitute for the name.
5. Label every arrow#
An unlabelled arrow is a guess. Say what flows along it, ideally with a verb and, when it matters, the protocol:
- "Places order (HTTPS)"
- "Publishes OrderPlaced"
- "Reads and writes (SQL)"
Keep arrows pointing in the direction of the request or the data, and be consistent. Two arrows between the same pair, one each way, are better than one double-headed arrow with an ambiguous label.
6. Group with zones that mean something#
Zones, the coloured background rectangles, are where a diagram gets its structure. Use them for boundaries that matter to the reader:
- Network boundaries: public subnet, private subnet, VPC.
- Trust boundaries: what is inside your system and what is a third party.
- Ownership: which team runs which services.
- Runtime: a Kubernetes cluster, a region, a serverless platform.
Give every zone a title, and use colour consistently. If green means "public" in one diagram, it should not mean "team A" in the next.
7. Cut until it fits on one screen#
As a rule of thumb, a diagram becomes hard to read beyond about 15 to 20 elements. When you get there, split it: one overview, then one diagram per area that needs detail. Readers can follow a link to the detail; they cannot un-see clutter.
Things that can usually go:
- Infrastructure nobody asked about (DNS, logging agents) in a functional diagram.
- Every instance of a scaled service: draw one box and write "×3" or "autoscaled".
- Arrows that repeat what a zone already says.
8. Add a title, a date and a key#
A diagram without context gets misread a year later. Add:
- A title that states the scope: "Checkout: container view".
- A date or version, so people know how current it is.
- A short key if you use colours or dashed lines with a specific meaning.
9. Keep it alive#
Diagrams go stale when they live somewhere nobody looks. Keep them next to the things they describe:
- Export the project file and commit it with the code it documents.
- Put the PNG in the README or design document, and link to an editable version. In ArchBoard, Share gives you a link that opens an editable copy.
- Update the diagram in the same pull request that changes the architecture.
A quick checklist#
- One reader, one question, one level of detail.
- The main path reads from left to right.
- Every box has a name and a technology.
- Every arrow has a label and a direction.
- Zones have titles and consistent colours.
- Fewer than about 20 elements, or split into several diagrams.
- A title, a date and, if needed, a key.
Want a head start? Every template follows these rules, and opens as your own editable copy.