The C4 model, explained with examples
The four levels of the C4 model, its notation, and when to use each diagram.
The C4 model is a simple way to describe software architecture at several levels of detail, like zooming in on a map. It was created by Simon Brown and is documented at c4model.com. Its strength is that it gives a team a shared vocabulary without a heavy notation to learn.
This guide covers the four levels, the notation, the mistakes to avoid, and gives you a free, editable template for each of the three levels you will draw most.
The four levels#
C4 stands for its four levels of diagrams: Context, Containers, Components and Code. Each one zooms into one box of the level above.
| Level | Question it answers | Audience |
|---|---|---|
| 1. System context | What is the system, who uses it and what does it depend on? | Everyone, including non-technical people |
| 2. Container | What are the apps and data stores, and how do they talk? | Engineers, operations, security |
| 3. Component | What are the main parts inside one container? | Developers working on that container |
| 4. Code | How is one component implemented? | Rarely drawn by hand; usually generated |
Most teams get the most value from levels 1 and 2. Draw level 3 only for complex containers, and generate level 4 from the code when you need it.
Level 1: system context#
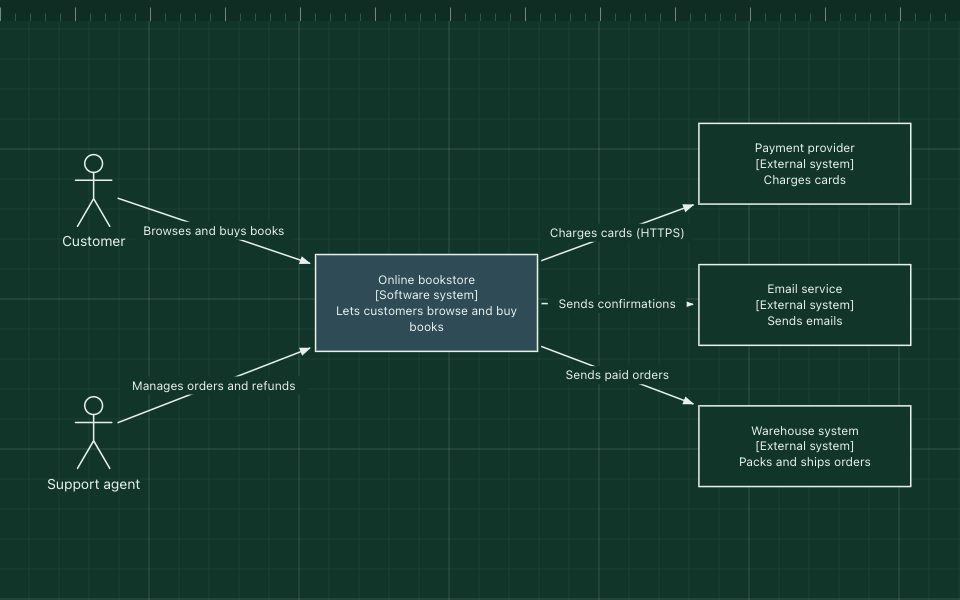
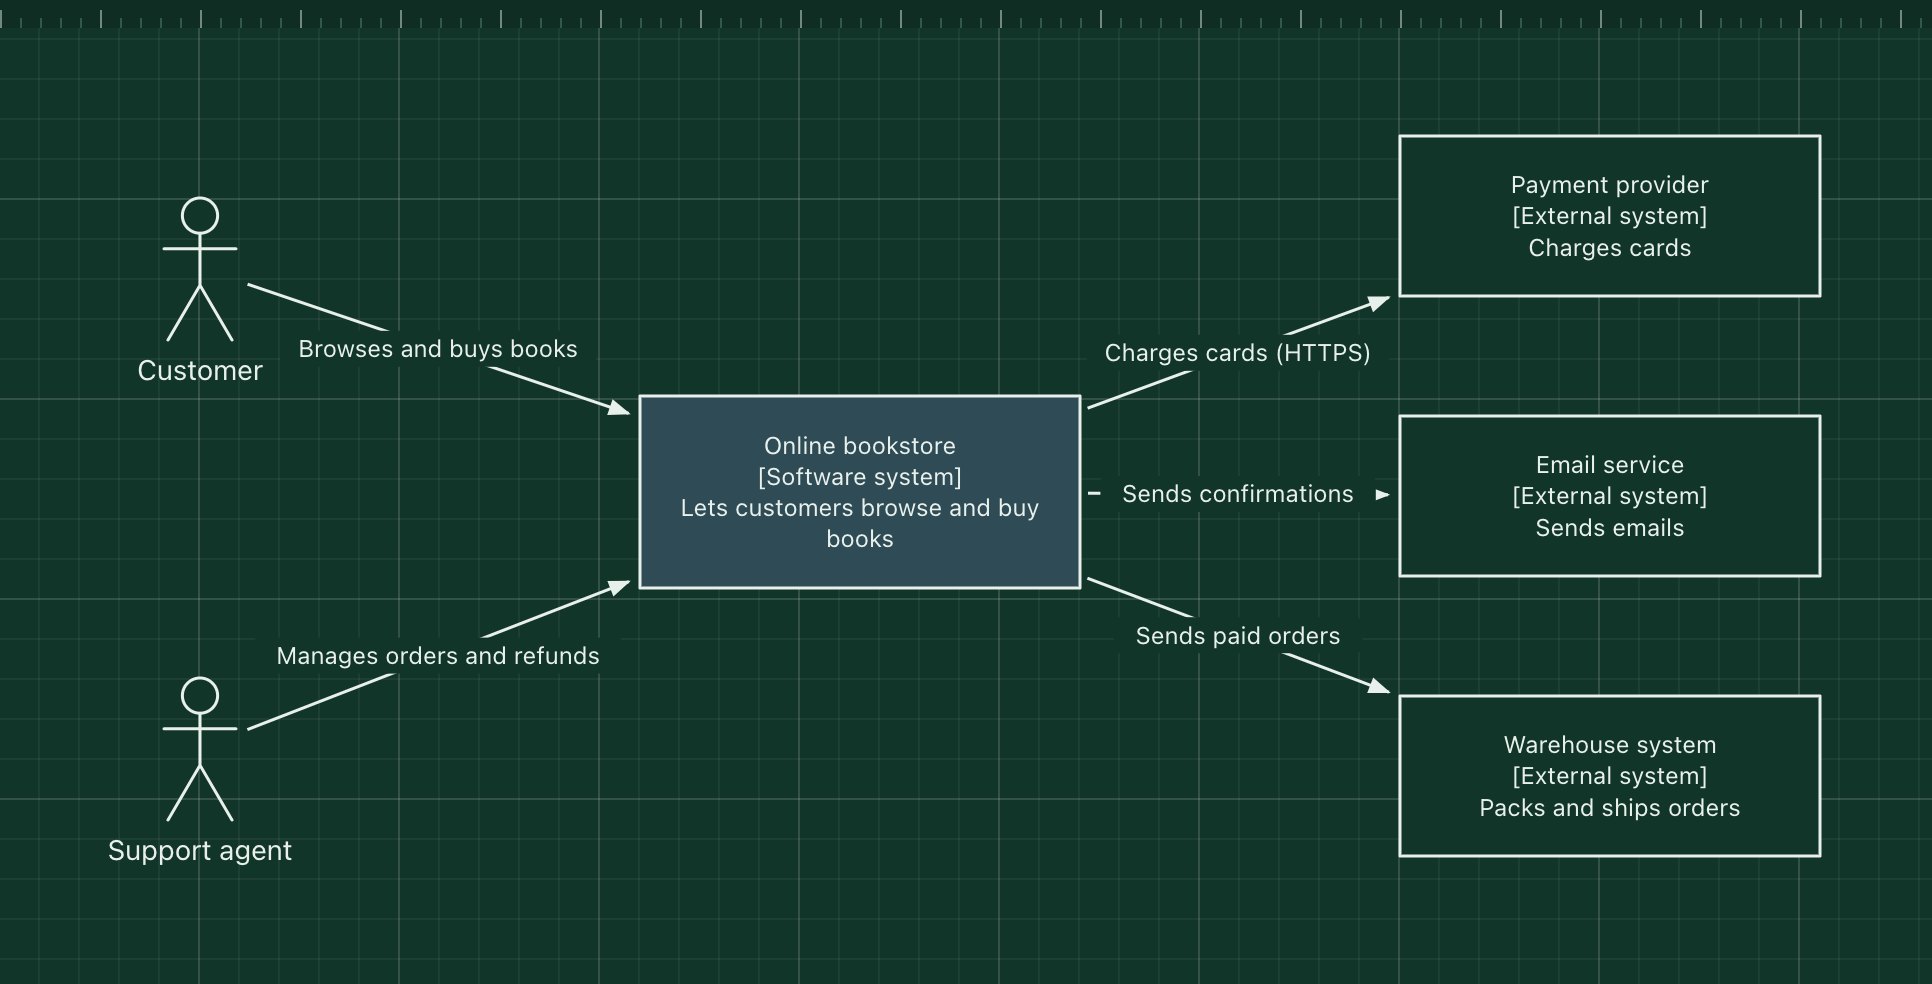
The system context diagram shows your software system as a single box in the middle, the people who use it, and the other systems it interacts with. It deliberately says nothing about technology or internal structure.
Draw one for every system you own. It is the best first diagram for a README or a design document.
Level 2: containers#
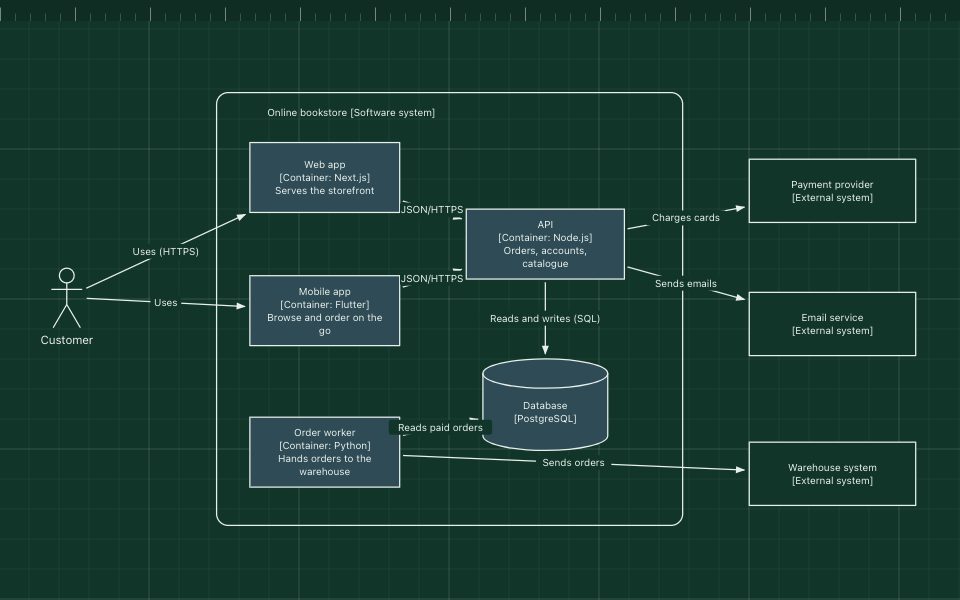
A container in C4 is something that runs or stores data on its own: a web app, a mobile app, an API, a database, a message queue, a serverless function. It is not the same as a Docker container, although a C4 container often runs in one.
The container diagram zooms into your system and shows its containers, the technology of each, and how they communicate.
Level 3: components#
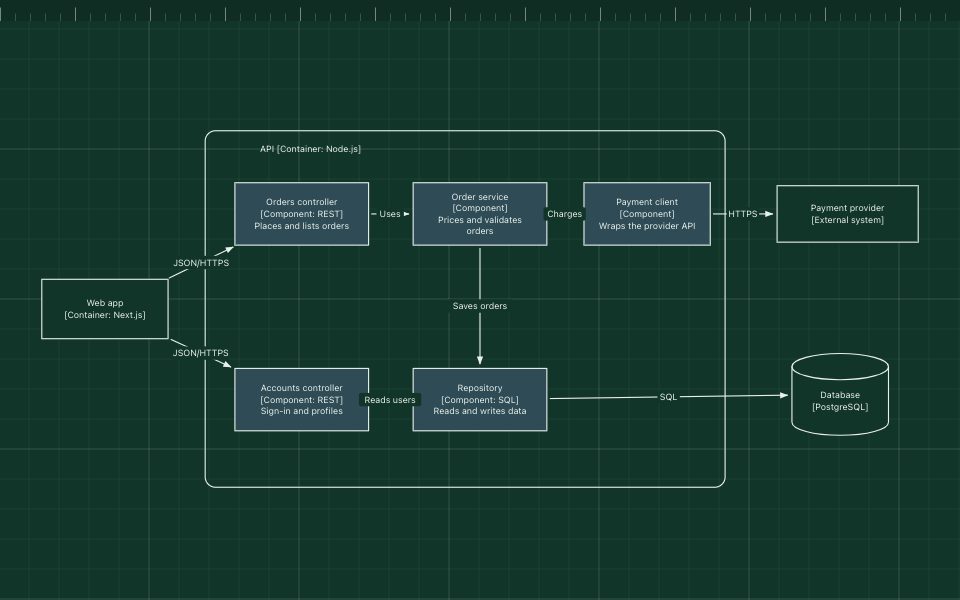
A component is a group of related code behind a clear interface inside one container, for example a controller, a service or a repository. The component diagram shows the main components of one container and how they collaborate.
Component diagrams go out of date quickly, because code moves faster than architecture. Keep them for containers that are large, complex or about to be refactored.
The notation#
C4 is intentionally notation-independent: you can use any shapes, as long as each diagram is self-explanatory. The conventions most teams follow:
- Every element has a name, a type and a short description. For example: "API / [Container: Node.js] / Orders, accounts and catalogue".
- Relationships are one-way arrows with a label, describing intent and, where useful, the technology: "Reads and writes (SQL)".
- Boundaries show what belongs to the system or container in scope.
- People are drawn as stick figures, external systems in a neutral colour, and your own elements highlighted.
- Every diagram has a title and a key, so it can be understood without its author in the room.
Supporting diagrams#
Besides the four core levels, C4 describes a few supporting diagrams. The most useful are:
- Deployment diagrams: how containers map to infrastructure, such as clusters, regions and managed services. Several templates, like the multi-region and Kubernetes ones, are effectively deployment views.
- Dynamic diagrams: a numbered sequence of interactions for one scenario, such as "customer places an order".
- System landscape diagrams: all the systems in an organisation and how they relate, a level above system context.
Common mistakes#
- Mixing levels. A database next to a class name next to a whole external system. Keep one level per diagram.
- Unlabelled arrows. "Uses" on every arrow says nothing. Say what flows and why.
- Missing technology on containers. At level 2, the technology is often the most important information.
- Drawing level 4 by hand. It will be wrong within weeks. Generate it, or skip it.
- No key. Colours and shapes that mean something to you mean nothing to the next reader.
Drawing C4 diagrams in ArchBoard#
ArchBoard has no special C4 mode, and does not need one. Use rectangles for systems, containers and components, with the name, type and description on separate lines. Use the person shape for users, and a rounded rectangle without fill as the boundary. Real technology icons are a useful addition at the container level.
Start from the templates above: each opens as your own editable copy, with no account needed.
C4 and diagrams as code#
If your team prefers to write diagrams as text, Structurizr and C4-PlantUML let you define C4 models in code and render them. Diagrams as code are easy to review and version; a visual editor is faster for exploring and for people who do not want to learn a syntax. Many teams use both: code for the long-lived model, a visual tool for design sessions and one-off explanations.