12 architecture diagram best practices
Twelve rules that make the difference between a diagram people use and one they ignore.
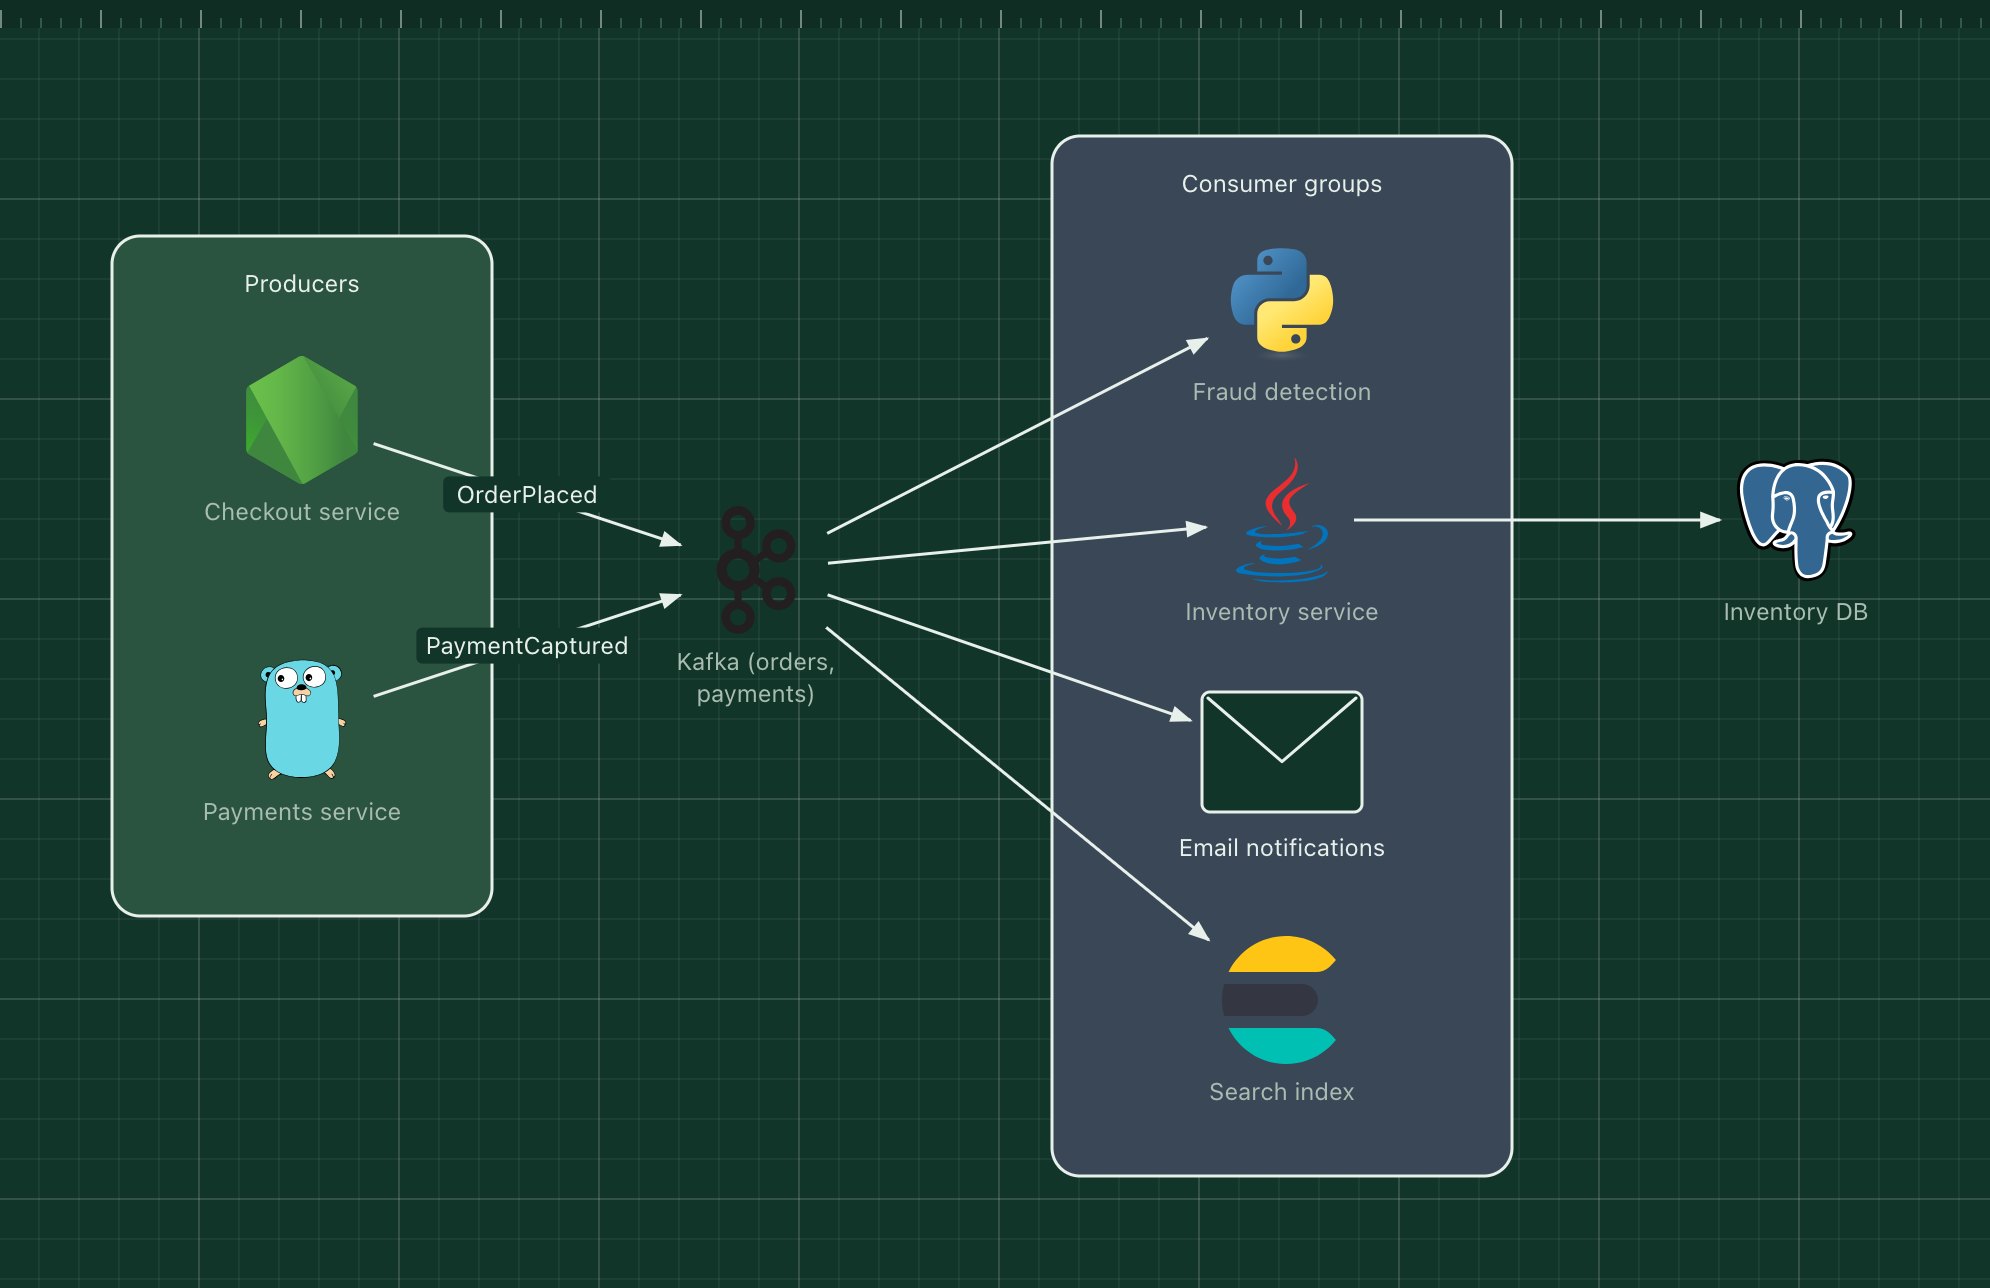
These rules come from the same place as most diagram advice: diagrams that were misread, ignored or quietly out of date. None of them needs a special tool or notation. If you only remember three, remember 1, 5 and 12.
1. One diagram, one question#
Write the question the diagram answers in its title: "How does an order reach the warehouse?" is a better title than "Architecture". If two readers need two different answers, draw two diagrams.
2. Keep one level of detail#
Do not put whole external systems, internal services and individual classes on the same canvas. Pick a level, such as context, containers or components, and stay there. The C4 model gives these levels names your team can share.
3. Name things the way people talk about them#
Use the names from the code, the dashboards and the incident channel. If everyone says "the ledger", the box should say "Ledger", not "Financial transaction persistence service".
4. Show the technology#
At the container level, "Payments (Java, Spring)" and a recognisable icon tell an engineer what to expect: how it is deployed, how it fails, who knows it. Leave technology out at the context level, where it distracts non-technical readers.
5. Label every arrow#
An arrow without a label forces the reader to guess whether it is a call, a data flow or a dependency. Use a verb and, when it matters, the protocol: "Publishes OrderPlaced (Kafka)", "Reads (SQL)".
6. Make direction consistent#
Choose what arrows mean, either who calls whom or where data goes, and stick to it across the diagram. Lay the main flow out left to right or top to bottom so the eye can follow it.
7. Use colour for meaning, not decoration#
Colour is the first thing a reader notices, so make it carry information: public versus private, yours versus third party, one team versus another. Use few colours, and say what they mean in a key.
8. Use zones for boundaries#
Group components that share a boundary, such as a network, a trust level, a team or a runtime, inside a titled zone. Zones turn a flat graph into something with structure.
9. Fewer than about 20 elements#
Past that point readers stop following arrows and start guessing. Split large systems into an overview plus detailed diagrams per area, and link them together.
10. Avoid crossing lines#
Crossings are where readers lose the thread. Rearranging boxes almost always removes them; when it does not, the diagram may be showing two things that belong in two diagrams.
11. Add a title, a date and a key#
A diagram found in a wiki two years later should explain itself: what it shows, when it was true, and what the colours and line styles mean.
12. Keep diagrams next to what they describe#
Diagrams decay when they live in a separate tool nobody opens. Store the source next to the code, show the image where people read (README, design docs, runbooks), and update both in the same pull request as the change.
In ArchBoard, Export saves the editable project as a JSON file you can commit, the camera button saves a PNG for documents, and Share creates a link that opens an editable copy.
A diagram that follows the rules#
Every ArchBoard template is drawn with these rules: one question each, labelled arrows, titled zones and real technology icons. Open one, replace the parts with yours, and you have a diagram that follows all twelve.