Event-driven architecture with Kafka architecture diagram
In an event-driven architecture, services announce what happened ("an order was placed") instead of telling other services what to do. Anything that cares about the event subscribes to it.
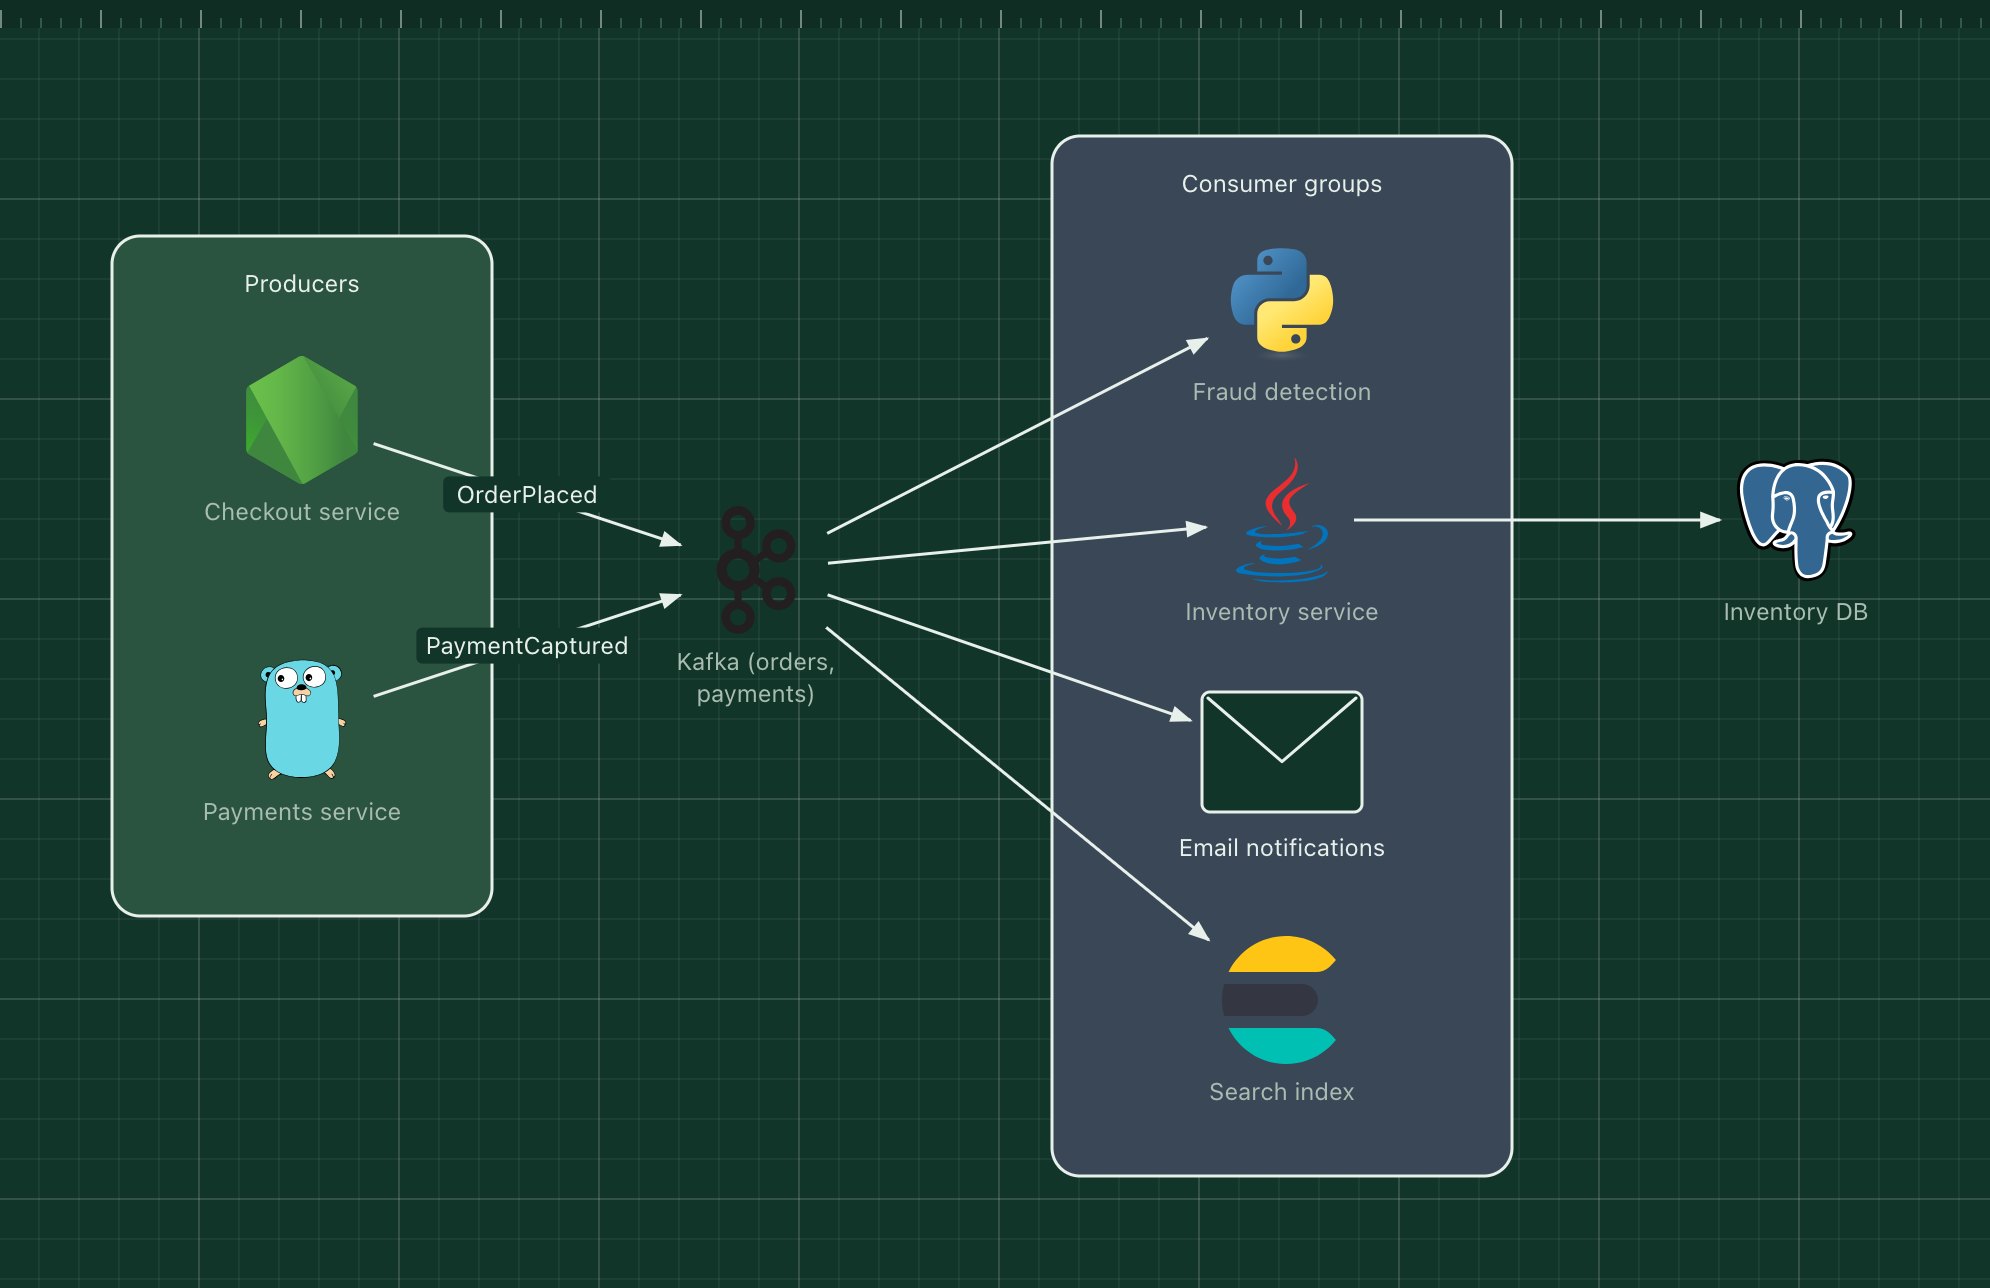
This template uses Apache Kafka as the event backbone: two producers publish, and four independent consumers react, each in its own consumer group so each one sees every event.
What's in the diagram
- Checkout and Payments services
- Producers. They write events to Kafka topics and move on without waiting for anyone downstream.
- Kafka
- Stores events in ordered, partitioned topics and keeps them for a configurable time, so consumers can catch up or replay.
- Fraud detection
- Scores each order as it arrives and can raise a follow-up event if it looks suspicious.
- Inventory service
- Reserves stock and keeps its own database up to date.
- Email notifications
- Sends the order confirmation and payment receipt.
- Search index
- Elasticsearch, fed from the same topics, so search reflects new orders within seconds.
How a request flows through it
- Checkout publishes an OrderPlaced event and returns to the customer immediately.
- Kafka appends the event to the orders topic.
- Each consumer group reads the event independently and at its own pace.
- Payments publishes PaymentCaptured when the charge succeeds, and the same consumers react to it.
- If a consumer is down, it resumes from its last committed offset when it comes back.
When to use this architecture
Use it when one action triggers several independent reactions, when you need an audit trail of what happened, or when downstream systems are slower than the user-facing path. It adds operational work (topics, schemas, consumer lag), so it pays off once you have more than two or three consumers.
Ways to adapt the template
- Add a schema registry next to Kafka to version event formats.
- Send failed events to a dead-letter topic for later inspection.
- Replace Kafka with a managed service such as Confluent Cloud or Amazon MSK.
- Add a data warehouse consumer for analytics (see the data pipeline template).
How to customise this diagram
- Open your copy. Click Open in the editor. The template opens as your own project, saved in your browser. Nothing is uploaded.
- Rename the parts. Double-click any label, such as “Checkout service”, type your own name, then click outside it. Arrow labels work the same way.
- Swap a technology. Select Checkout service and press Delete. Search the icon palette for the technology you use, drag it onto the board, and reconnect it by dragging its arrow handle onto the next component.
- Add what is missing. Drag more icons or shapes onto the board. Shapes include databases, servers, users, queues, mail, alerts and scheduled jobs.
- Adjust the zones. Zones are rounded rectangles with a fill colour. Resize them to fit, pick another colour from the selection bar, and press [ to send a zone behind the components.
- Export or share. Save the diagram as a PNG with the camera button, download the project as JSON with Export, or copy a link with Share.