Batch data pipeline (ETL) architecture diagram
A batch data pipeline copies data out of the systems that run the business and reshapes it for analysis. ETL stands for its three steps: extract, transform, load.
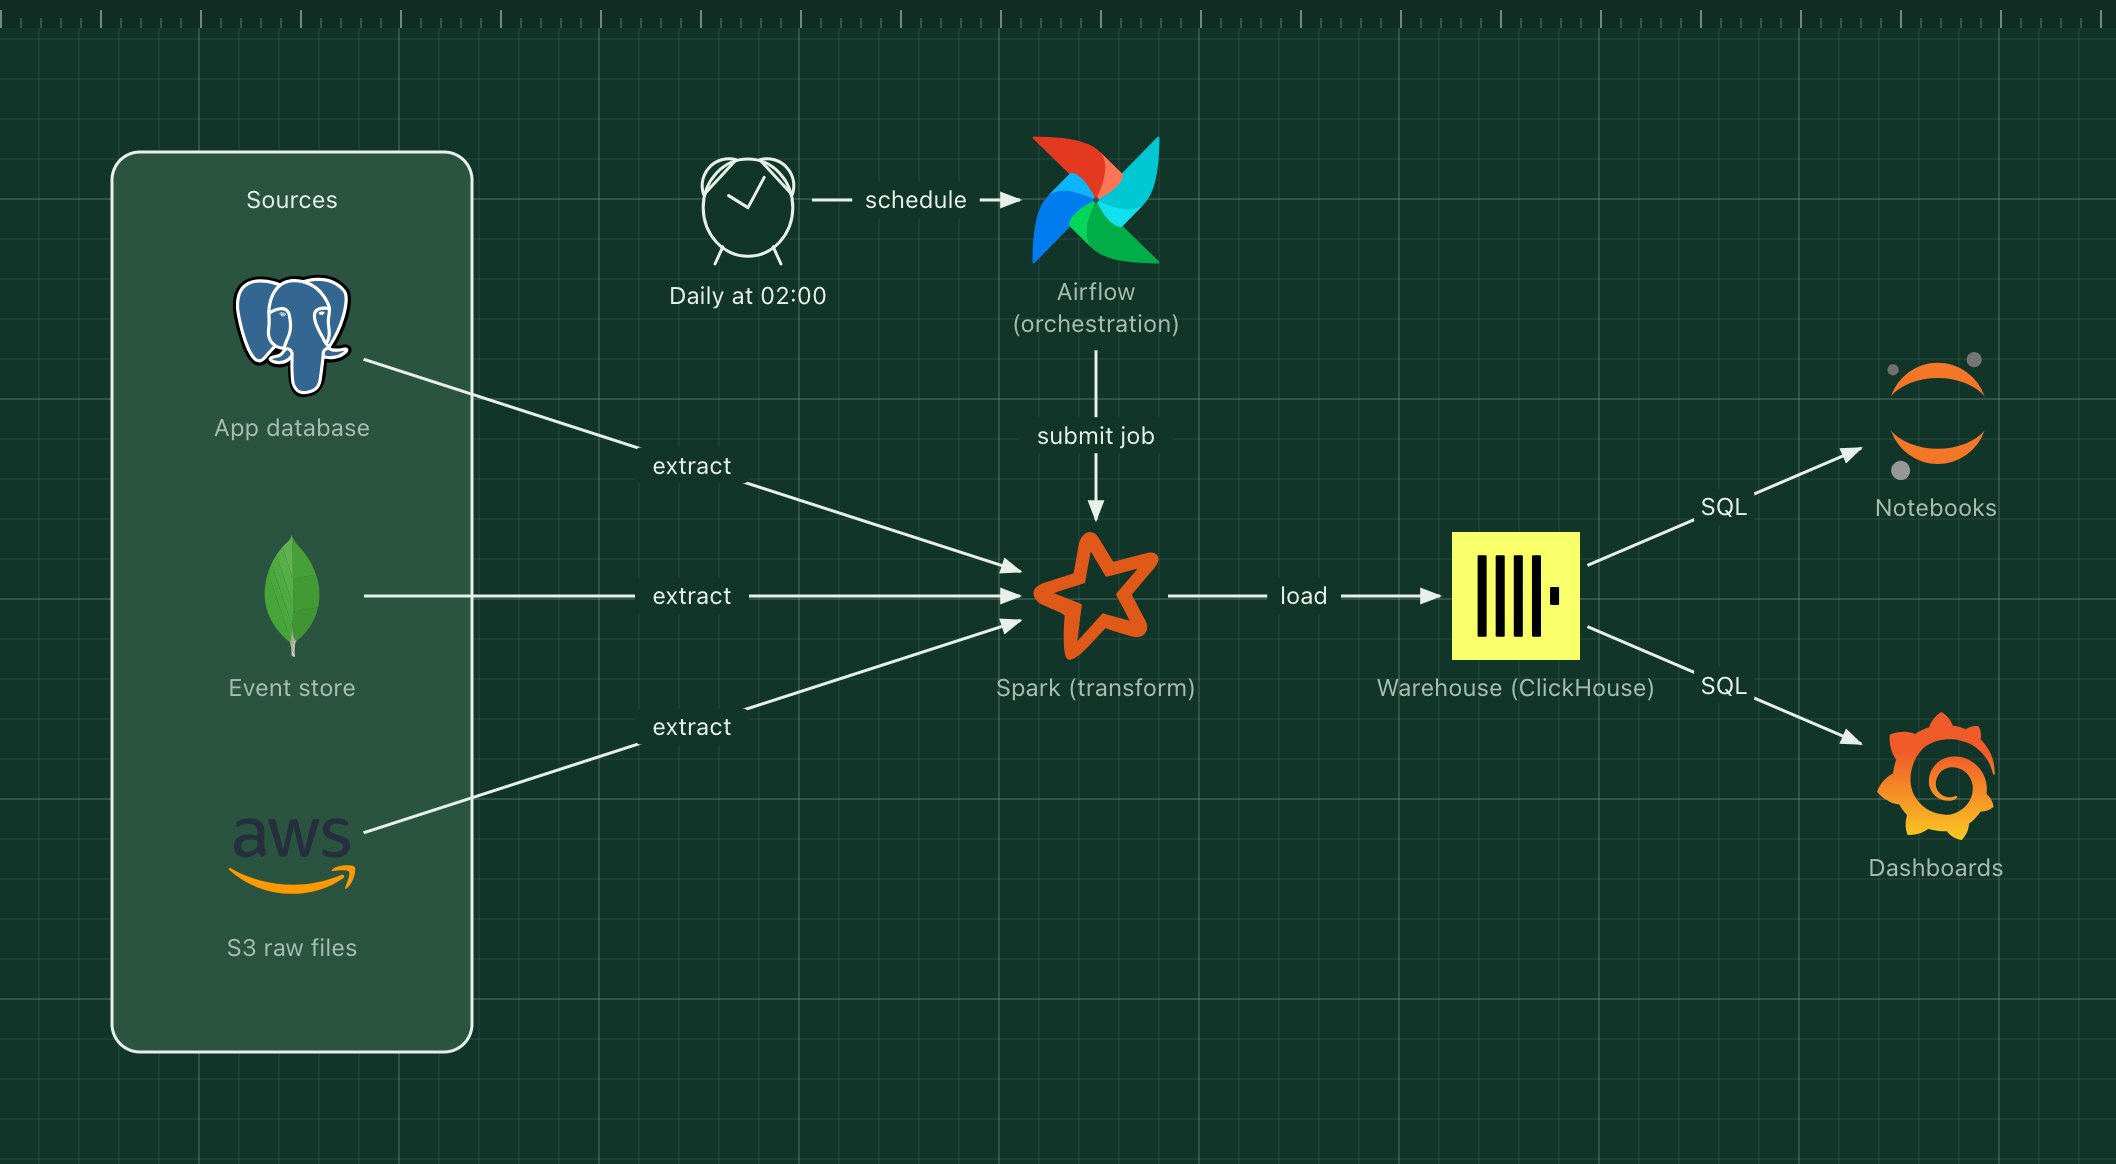
This template shows a nightly pipeline: Airflow decides when jobs run, Spark does the heavy transformation, and ClickHouse stores the result for fast analytical queries.
What's in the diagram
- Sources
- The production PostgreSQL database, a MongoDB event store and raw files in S3.
- Airflow
- Defines the pipeline as a DAG of tasks, runs it on schedule and retries failed steps.
- Spark
- Reads from all sources in parallel, joins and cleans the data, and writes the result.
- Warehouse (ClickHouse)
- A column store built for aggregations over billions of rows.
- Notebooks and dashboards
- Where analysts explore the data and where the business reads the numbers.
How a request flows through it
- At 02:00 the schedule triggers the Airflow DAG.
- Airflow submits the Spark job and waits for it.
- Spark extracts the previous day's data from each source, preferably from a read replica.
- It transforms the data into clean, denormalized tables and loads them into ClickHouse.
- Dashboards and notebooks query the warehouse with SQL in the morning.
When to use this architecture
Use it when reports can be a few hours old and the data is too big or too messy to query in production. If you need numbers within seconds, combine it with the event-driven template and stream into the warehouse instead.
Ways to adapt the template
- Replace Spark with dbt if all transformations can be written in SQL inside the warehouse.
- Swap ClickHouse for BigQuery, Snowflake or DuckDB.
- Add a data quality check task before the load step.
- Split the zone into bronze, silver and gold layers for a lakehouse layout.
How to customise this diagram
- Open your copy. Click Open in the editor. The template opens as your own project, saved in your browser. Nothing is uploaded.
- Rename the parts. Double-click any label, such as “App database”, type your own name, then click outside it. Arrow labels work the same way.
- Swap a technology. Select App database and press Delete. Search the icon palette for the technology you use, drag it onto the board, and reconnect it by dragging its arrow handle onto the next component.
- Add what is missing. Drag more icons or shapes onto the board. Shapes include databases, servers, users, queues, mail, alerts and scheduled jobs.
- Adjust the zones. Zones are rounded rectangles with a fill colour. Resize them to fit, pick another colour from the selection bar, and press [ to send a zone behind the components.
- Export or share. Save the diagram as a PNG with the camera button, download the project as JSON with Export, or copy a link with Share.