IoT telemetry pipeline architecture diagram
IoT systems collect small readings from thousands or millions of devices over unreliable networks. The pipeline has to accept data whenever devices manage to send it, absorb bursts, react quickly to problems and keep years of history for analysis.
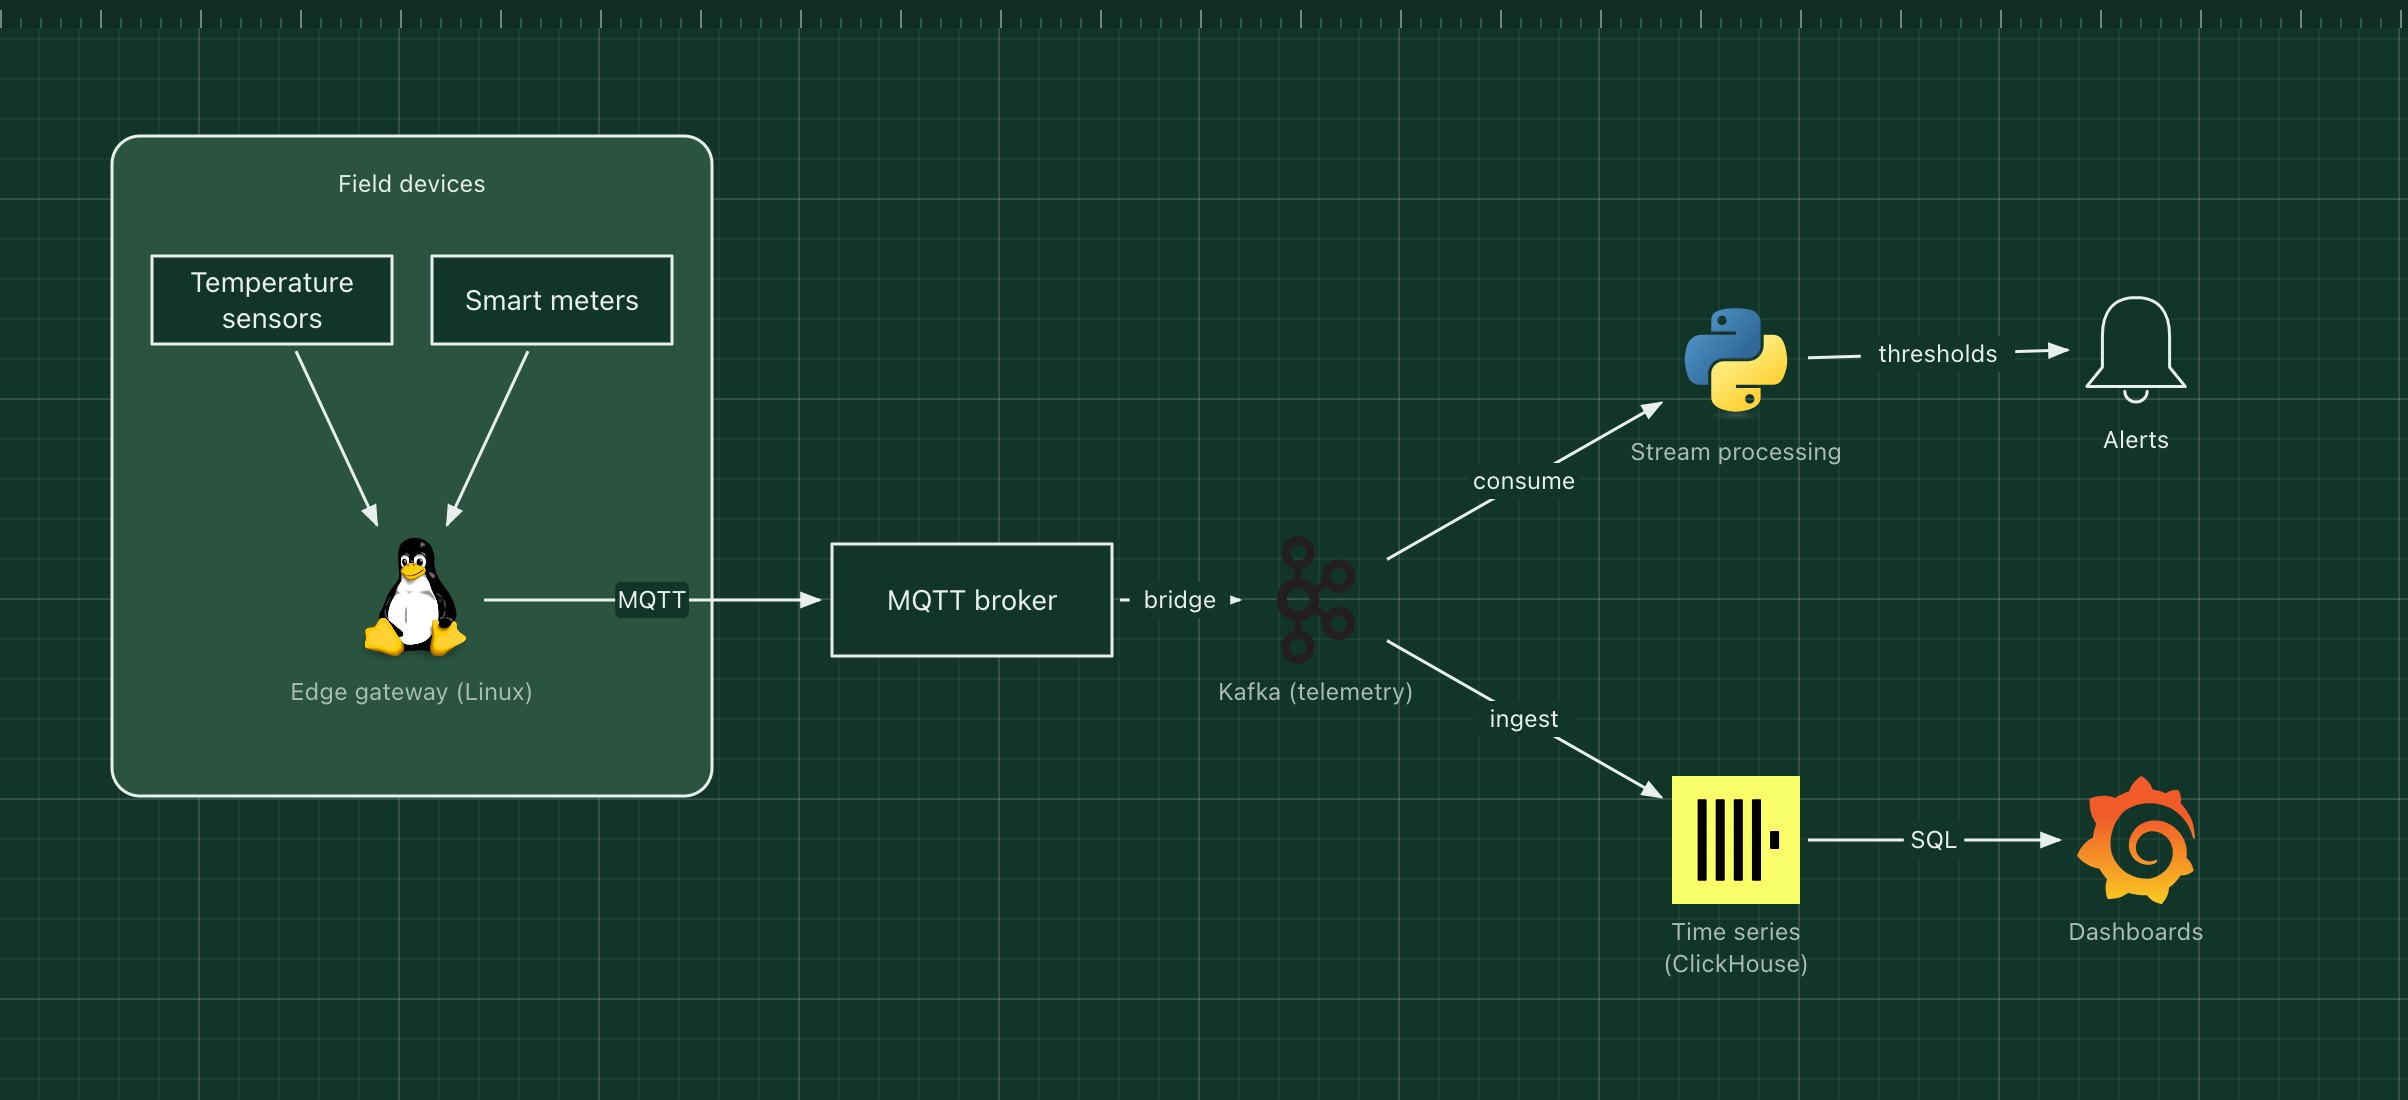
This template shows a common shape: devices publish over MQTT, Kafka buffers and fans out the stream, a stream processor raises alerts in real time, and a column store keeps the history for dashboards.
What's in the diagram
- Sensors and meters
- Send small readings, such as temperature or energy use, every few seconds or minutes.
- Edge gateway
- Collects readings from nearby devices, buffers them during outages and forwards them securely.
- MQTT broker
- A lightweight publish/subscribe protocol built for constrained devices and flaky networks.
- Kafka (telemetry)
- Durable, replayable storage for the raw stream, decoupling ingestion from processing.
- Stream processing
- Checks readings as they arrive, for example a freezer above -15 °C for five minutes, and raises alerts.
- Time series (ClickHouse)
- Stores every reading in compressed columns for fast aggregation over long periods.
How a request flows through it
- A sensor sends a reading to the edge gateway.
- The gateway publishes it to an MQTT topic such as site/42/freezer/3/temperature.
- A bridge copies MQTT messages into a Kafka topic.
- The stream processor evaluates alert rules and notifies on-call staff when one fires.
- In parallel, readings are written to ClickHouse, and Grafana charts them per site and device.
When to use this architecture
Use it for fleets of devices that report regularly and where both live alerts and long-term history matter. For a few hundred devices, a managed IoT service or a single time-series database may be all you need; Kafka earns its place when volume, replays or several consumers come in.
Ways to adapt the template
- Use a managed IoT hub for device identity, provisioning and certificates.
- Send commands back to devices on separate MQTT topics.
- Downsample old data to hourly averages to cut storage costs.
- Swap ClickHouse for TimescaleDB or InfluxDB.
How to customise this diagram
- Open your copy. Click Open in the editor. The template opens as your own project, saved in your browser. Nothing is uploaded.
- Rename the parts. Double-click any label, such as “Edge gateway (Linux)”, type your own name, then click outside it. Arrow labels work the same way.
- Swap a technology. Select Edge gateway (Linux) and press Delete. Search the icon palette for the technology you use, drag it onto the board, and reconnect it by dragging its arrow handle onto the next component.
- Add what is missing. Drag more icons or shapes onto the board. Shapes include databases, servers, users, queues, mail, alerts and scheduled jobs.
- Adjust the zones. Zones are rounded rectangles with a fill colour. Resize them to fit, pick another colour from the selection bar, and press [ to send a zone behind the components.
- Export or share. Save the diagram as a PNG with the camera button, download the project as JSON with Export, or copy a link with Share.