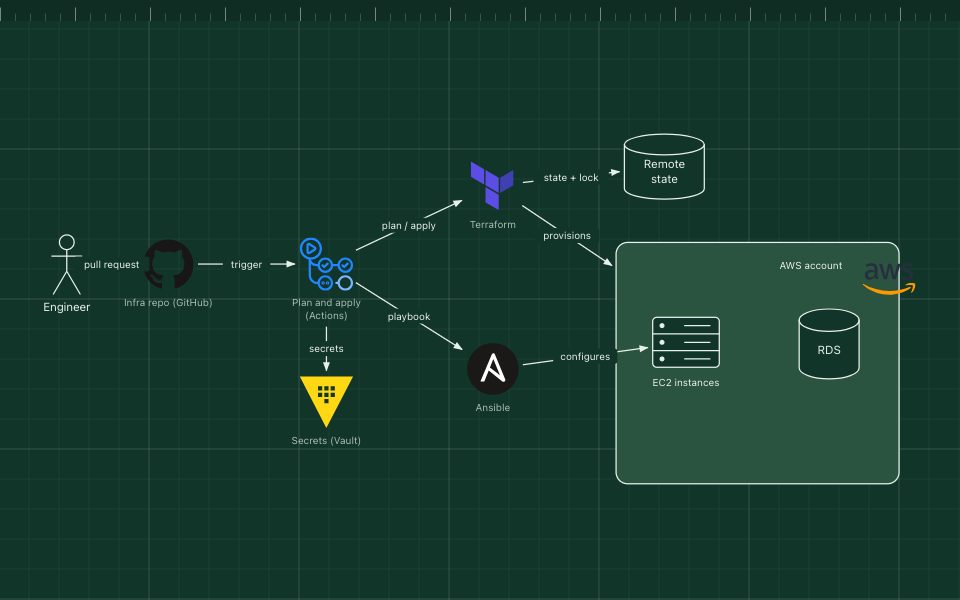
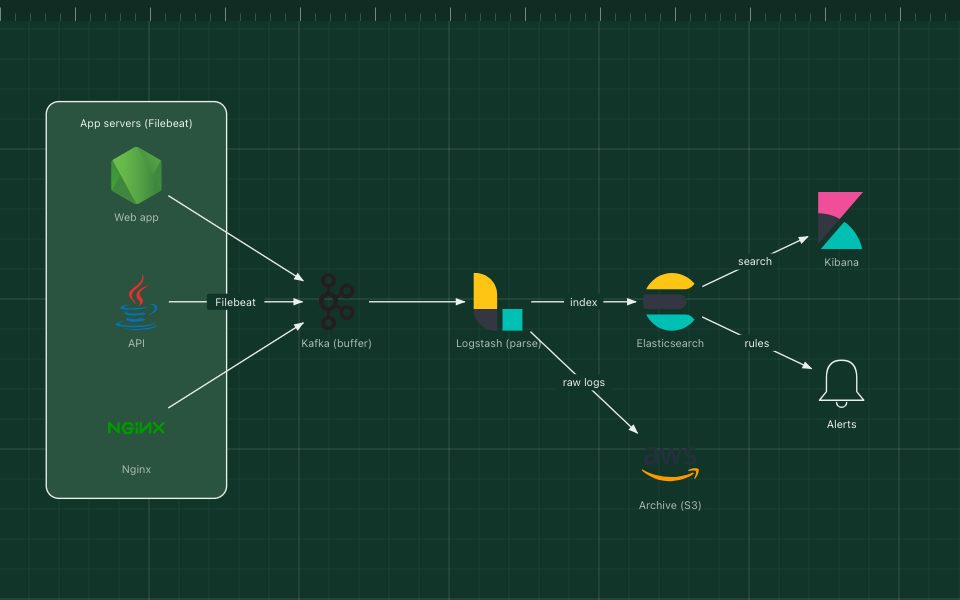
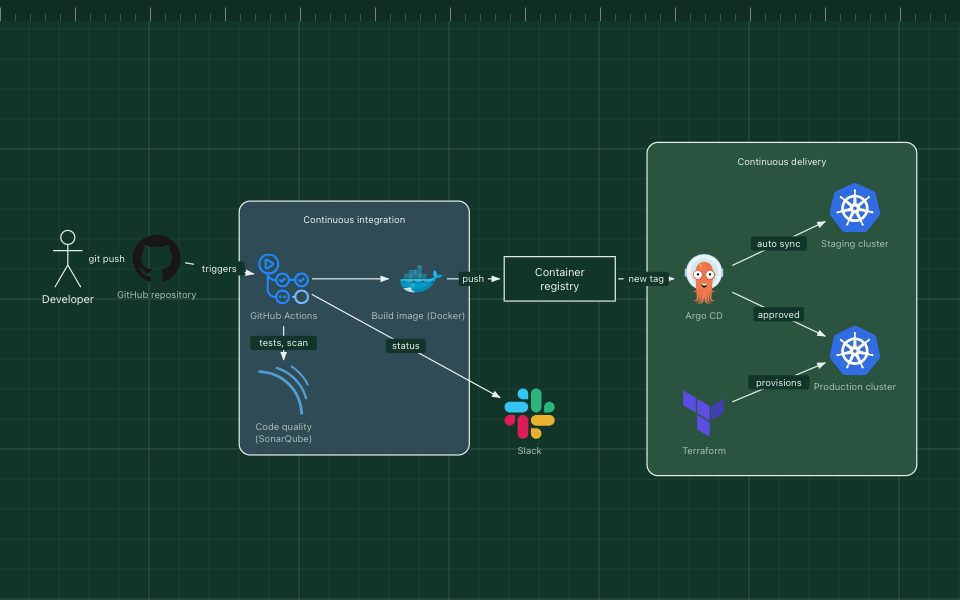
Observability stack architecture diagram
Observability is how you find out what a running system is doing from the outside. It rests on three kinds of telemetry: metrics (numbers over time), logs (events) and traces (one request followed across services).
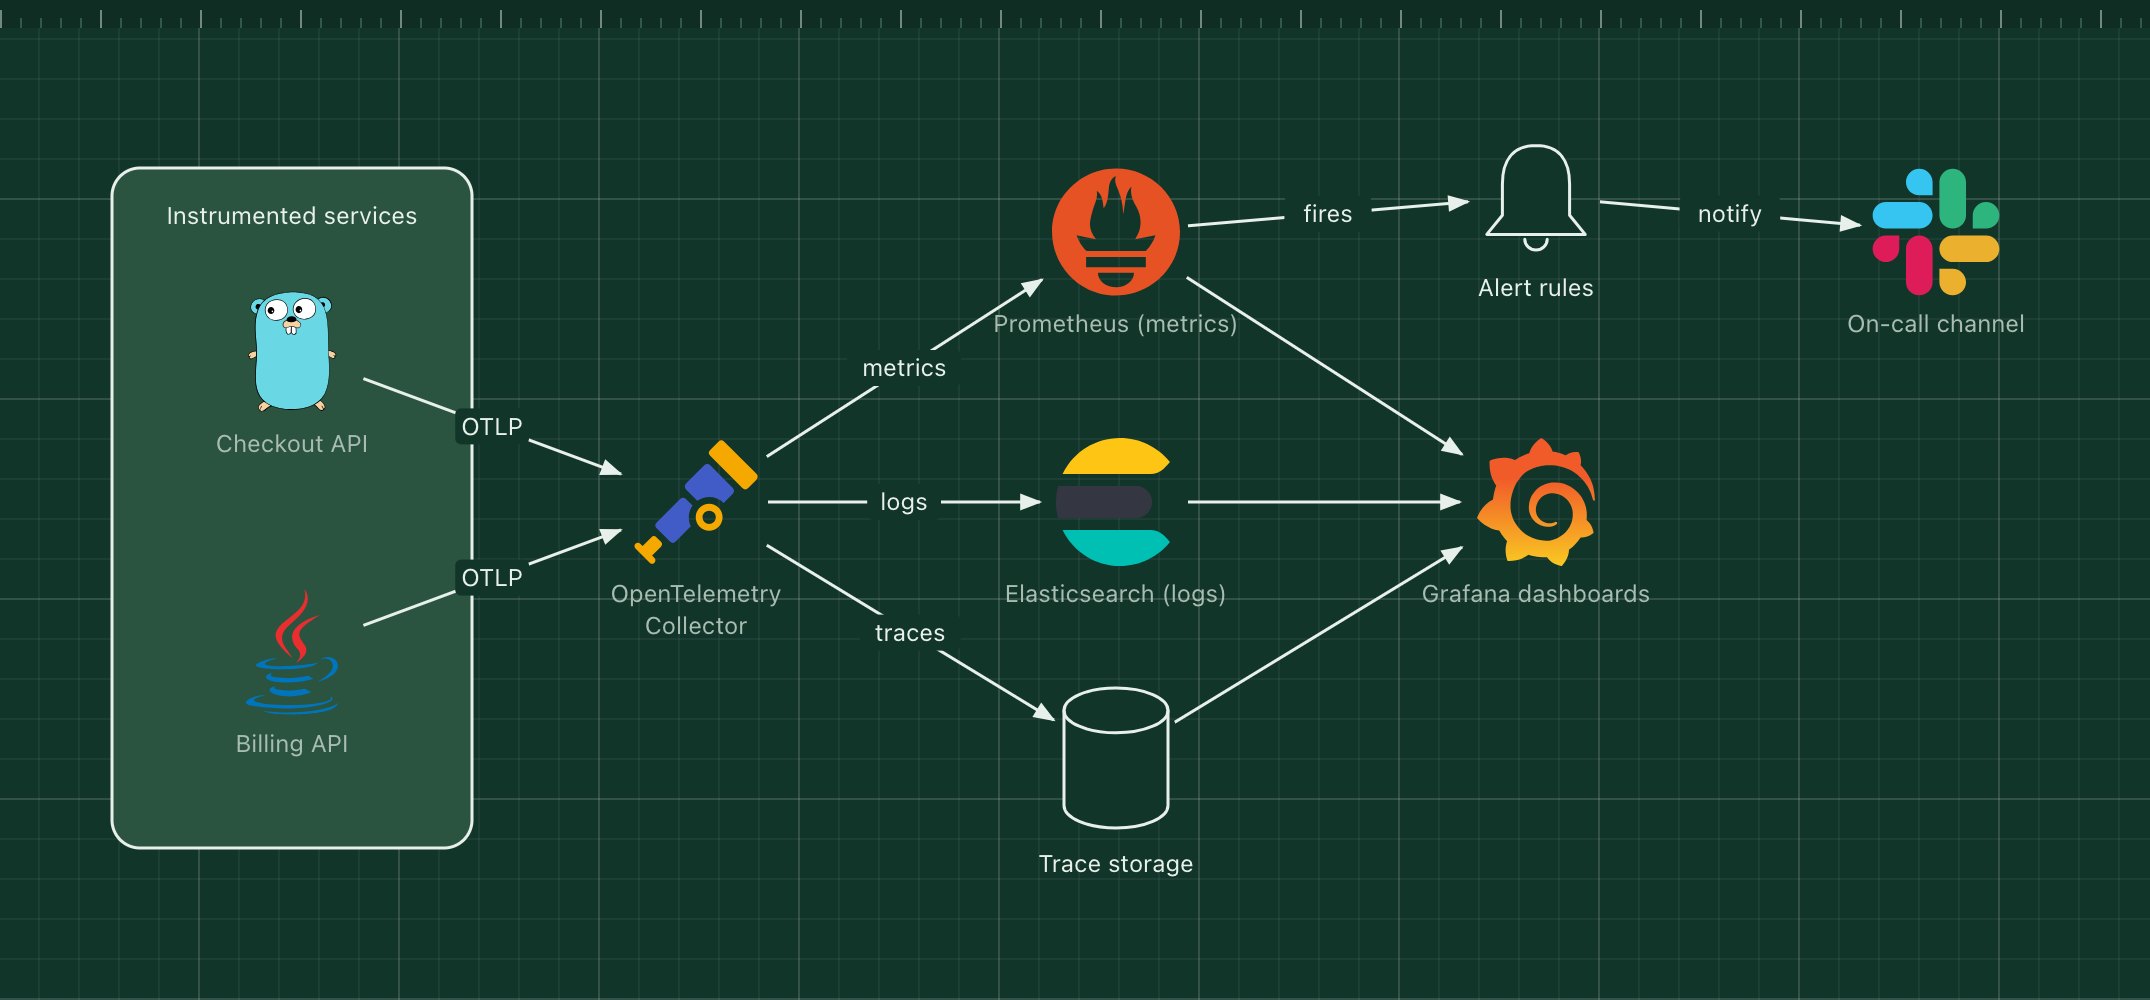
This template routes all three through an OpenTelemetry Collector, so services are instrumented once and the storage behind them can change without touching application code.
What's in the diagram
- Instrumented services
- Use the OpenTelemetry SDK to emit metrics, logs and traces over OTLP.
- OpenTelemetry Collector
- Receives, batches and filters telemetry, then exports each signal to the right backend.
- Prometheus
- Stores metrics and evaluates alert rules.
- Elasticsearch
- Indexes logs for full-text search.
- Trace storage
- Keeps distributed traces, for example in Jaeger or Grafana Tempo.
- Grafana
- One place to explore all three signals and jump from a metric spike to the traces behind it.
How a request flows through it
- A request to the Checkout API creates a trace and increments its metrics.
- The service exports the data over OTLP to the collector.
- The collector sends metrics to Prometheus, logs to Elasticsearch and spans to trace storage.
- Grafana queries all three for dashboards.
- When an alert rule fires in Prometheus, the on-call channel is notified.
When to use this architecture
Use it once you have more than one service, or as soon as "it is slow" becomes hard to answer from logs alone. The collector in the middle keeps vendor choices reversible.
Ways to adapt the template
- Replace the self-hosted backends with a managed observability vendor; the collector config is the only change.
- Swap Elasticsearch for Grafana Loki for cheaper log storage.
- Add sampling in the collector to control trace volume.
- Draw one zone per environment if staging and production share the stack.
How to customise this diagram
- Open your copy. Click Open in the editor. The template opens as your own project, saved in your browser. Nothing is uploaded.
- Rename the parts. Double-click any label, such as “Checkout API”, type your own name, then click outside it. Arrow labels work the same way.
- Swap a technology. Select Checkout API and press Delete. Search the icon palette for the technology you use, drag it onto the board, and reconnect it by dragging its arrow handle onto the next component.
- Add what is missing. Drag more icons or shapes onto the board. Shapes include databases, servers, users, queues, mail, alerts and scheduled jobs.
- Adjust the zones. Zones are rounded rectangles with a fill colour. Resize them to fit, pick another colour from the selection bar, and press [ to send a zone behind the components.
- Export or share. Save the diagram as a PNG with the camera button, download the project as JSON with Export, or copy a link with Share.