Centralized logging with the ELK stack architecture diagram
When an application runs on many servers, reading log files one machine at a time stops working. Centralized logging collects every line in one place where it can be searched, graphed and alerted on.
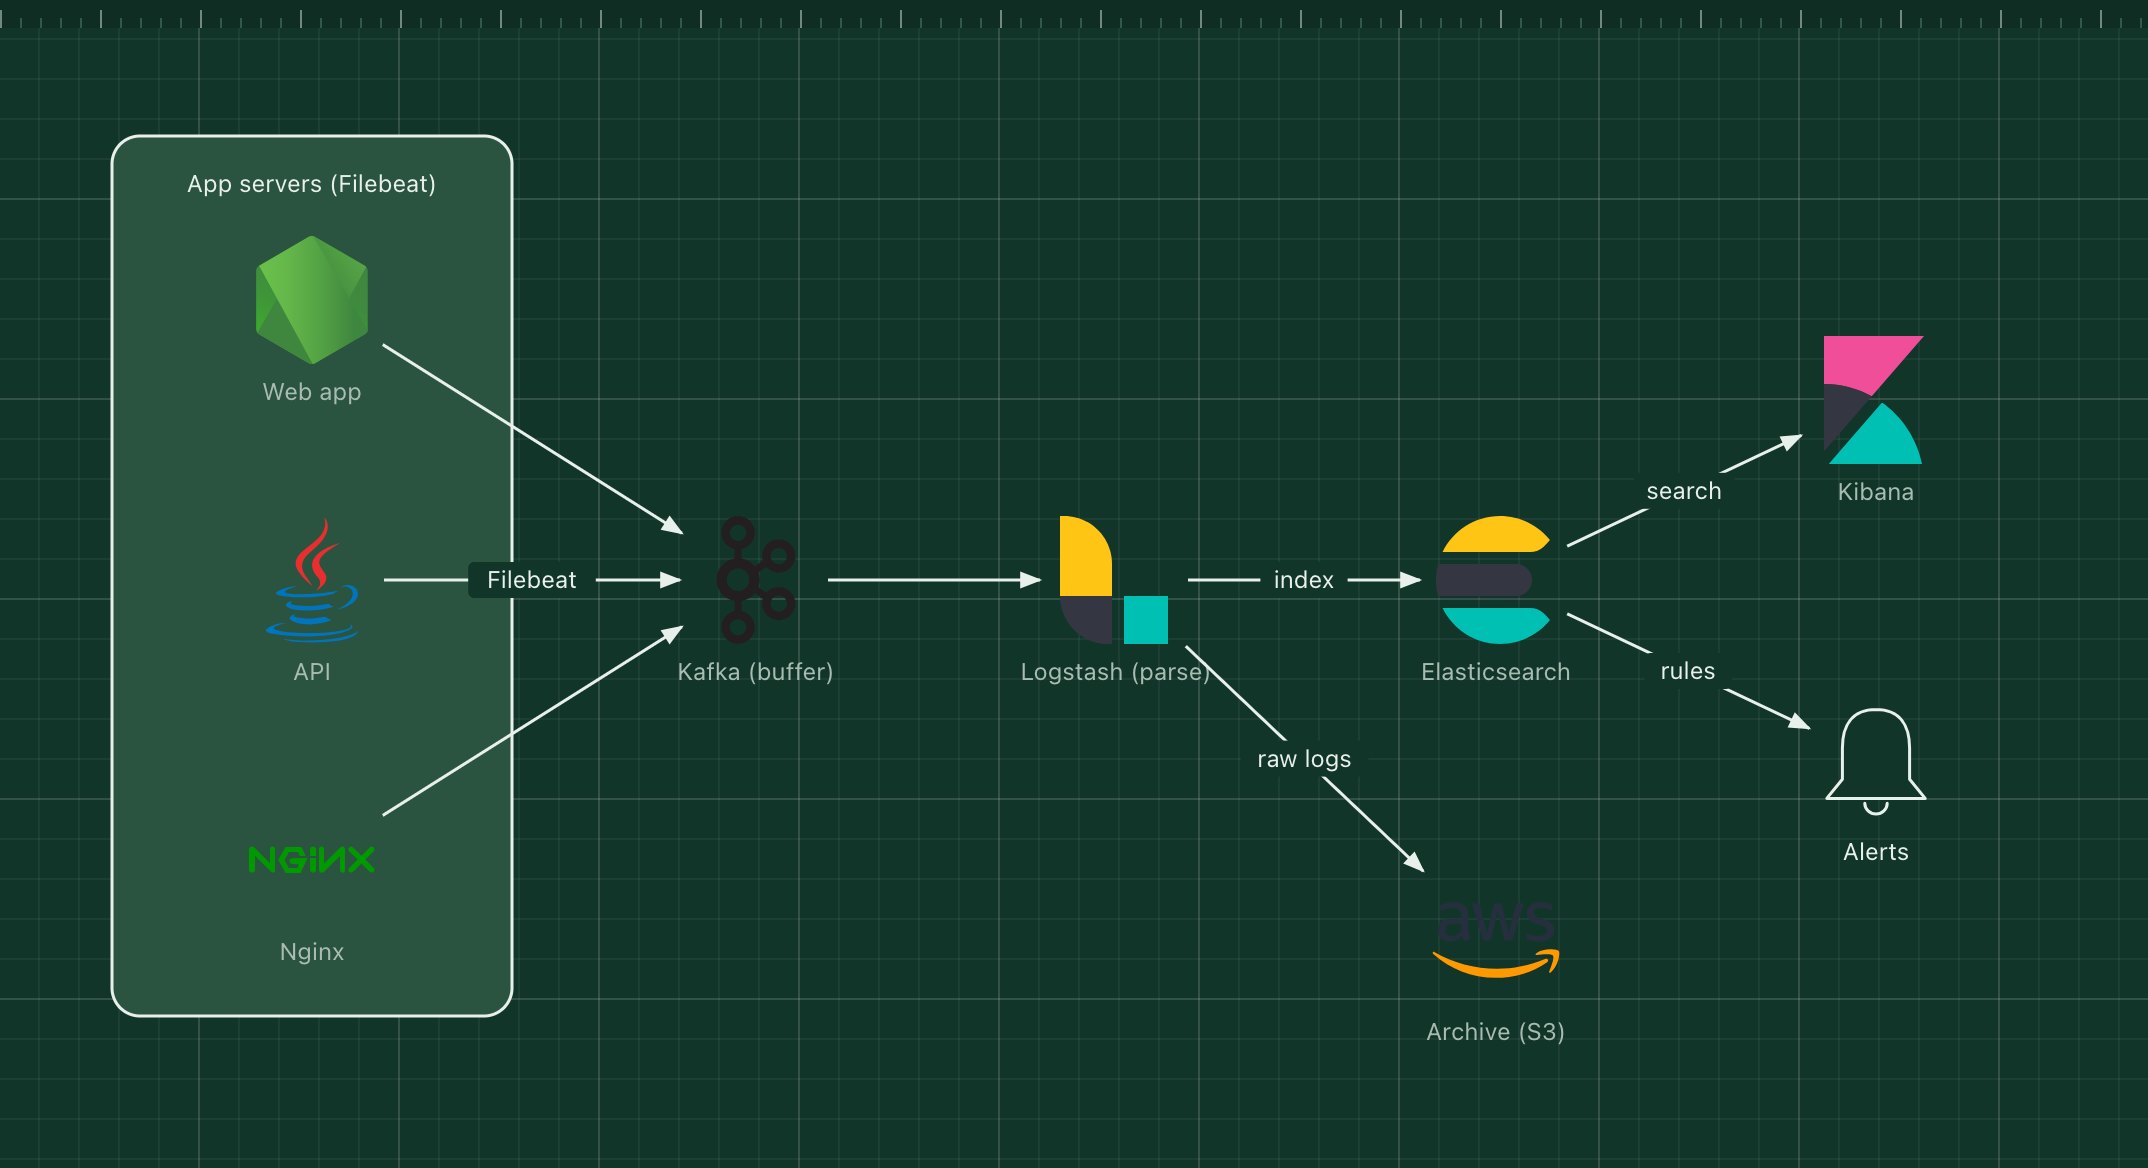
ELK is the classic open-source way to do it: Elasticsearch stores and searches, Logstash parses, and Kibana is the interface. This template adds Filebeat on each server and Kafka as a buffer so a burst of logs never takes the pipeline down.
What's in the diagram
- Filebeat
- A light agent on each server that tails log files and ships new lines, resuming where it left off after a restart.
- Kafka (buffer)
- Absorbs spikes, such as an incident that multiplies log volume, while Logstash catches up.
- Logstash
- Parses raw lines into fields (timestamp, level, request ID, user), drops noise and enriches events.
- Elasticsearch
- Indexes the events so a search across billions of lines returns in seconds.
- Kibana
- Search, dashboards and saved queries for developers and on-call staff.
- Archive (S3)
- Cheap long-term storage of the raw logs for audits, beyond the retention kept in Elasticsearch.
How a request flows through it
- An application writes a log line; Filebeat ships it to a Kafka topic.
- Logstash consumes the topic and parses the line into structured fields.
- It indexes the event in Elasticsearch and writes the raw line to S3.
- An engineer searches Kibana for a request ID and sees the full path across services.
- Alert rules on Elasticsearch notify the team when, for example, error rates jump.
When to use this architecture
Use it when you run several services or servers and need fast, flexible search over logs. Elasticsearch needs care: plan index lifecycle and retention from the start, because storage grows fast. If you mainly need metrics and traces, start from the observability template instead.
Ways to adapt the template
- Log in JSON from the apps so Logstash has less to parse.
- Replace Logstash with Elasticsearch ingest pipelines for simple parsing.
- Use OpenSearch, the open-source fork, with the same layout.
- Swap the stack for Grafana Loki if you mostly filter by labels rather than full-text search.
How to customise this diagram
- Open your copy. Click Open in the editor. The template opens as your own project, saved in your browser. Nothing is uploaded.
- Rename the parts. Double-click any label, such as “Web app”, type your own name, then click outside it. Arrow labels work the same way.
- Swap a technology. Select Web app and press Delete. Search the icon palette for the technology you use, drag it onto the board, and reconnect it by dragging its arrow handle onto the next component.
- Add what is missing. Drag more icons or shapes onto the board. Shapes include databases, servers, users, queues, mail, alerts and scheduled jobs.
- Adjust the zones. Zones are rounded rectangles with a fill colour. Resize them to fit, pick another colour from the selection bar, and press [ to send a zone behind the components.
- Export or share. Save the diagram as a PNG with the camera button, download the project as JSON with Export, or copy a link with Share.