GraphQL API gateway architecture diagram
Clients rarely want data in the shape each backend service provides. A GraphQL gateway gives every client one endpoint and a typed schema, and lets each screen ask for exactly the fields it needs in a single request.
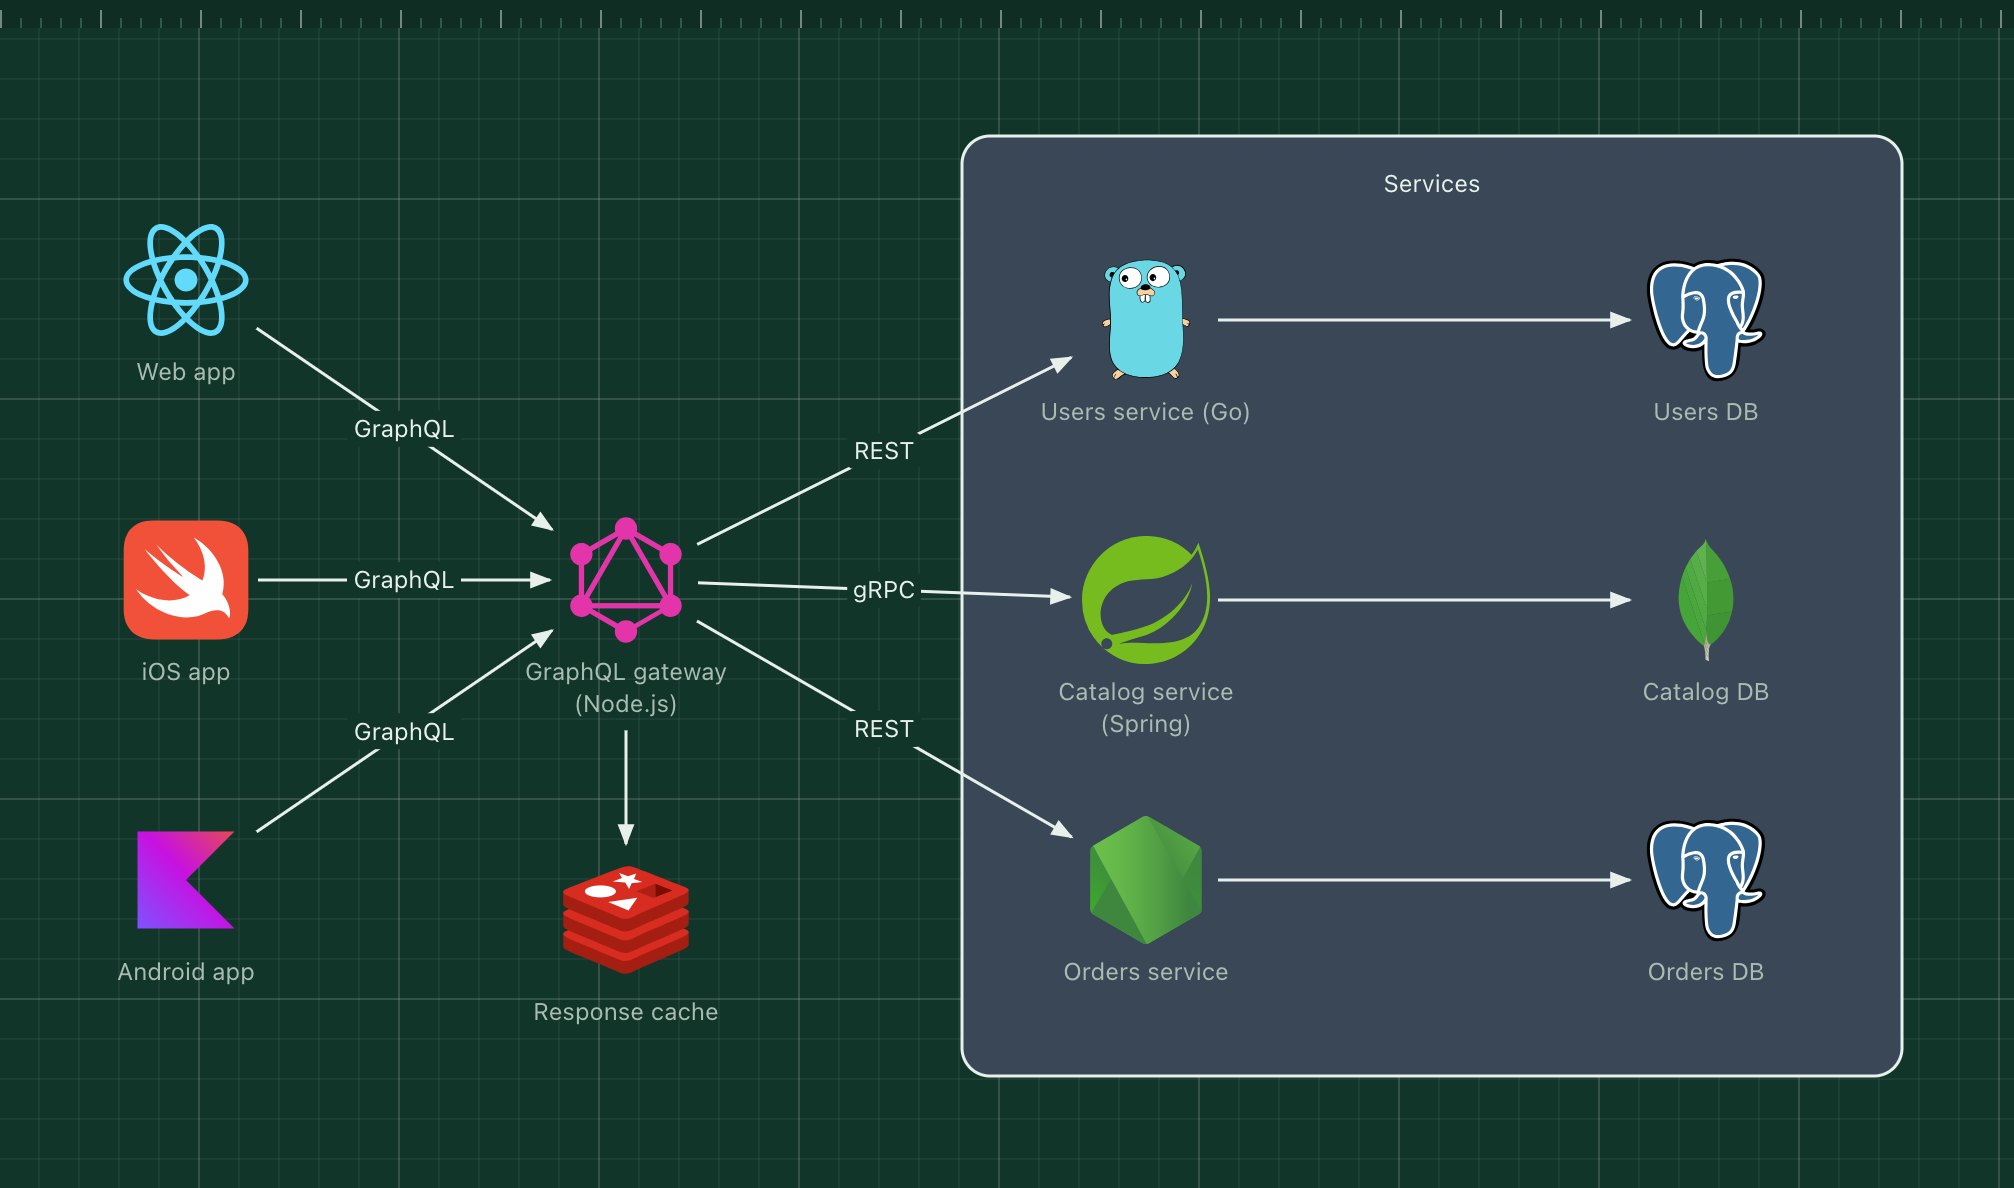
This template shows the gateway as a backend for frontend: web and mobile apps speak GraphQL, while the gateway fans out to services over REST or gRPC and assembles the response.
What's in the diagram
- Web, iOS and Android apps
- Send GraphQL queries describing the data each screen needs.
- GraphQL gateway (Node.js)
- Owns the public schema, checks authentication, and resolves each field by calling the right service.
- Response cache (Redis)
- Caches resolved results for data that changes slowly, such as the catalogue.
- Users service (Go)
- Profiles and accounts, backed by PostgreSQL.
- Catalog service (Spring)
- Products and prices, backed by MongoDB, exposed over gRPC.
- Orders service
- Carts and orders, backed by PostgreSQL.
How a request flows through it
- The mobile app sends one query for a product page: product, price, stock and the user's cart.
- The gateway validates the query against the schema and checks the user's token.
- Its resolvers call the catalog, users and orders services in parallel.
- Each service reads from its own database and returns its part.
- The gateway merges the results into exactly the shape the query asked for.
When to use this architecture
Use it when several clients consume many services and you want to stop building one REST endpoint per screen. It adds a layer to operate and secure, so limit query depth and cost, and batch calls to avoid the N+1 problem.
Ways to adapt the template
- Replace the single gateway with GraphQL federation, where each service owns part of the schema.
- Add persisted queries so mobile apps send a query ID instead of the full text.
- Put a CDN in front for public, cacheable queries.
- Add subscriptions over WebSockets for live updates.
How to customise this diagram
- Open your copy. Click Open in the editor. The template opens as your own project, saved in your browser. Nothing is uploaded.
- Rename the parts. Double-click any label, such as “Web app”, type your own name, then click outside it. Arrow labels work the same way.
- Swap a technology. Select Web app and press Delete. Search the icon palette for the technology you use, drag it onto the board, and reconnect it by dragging its arrow handle onto the next component.
- Add what is missing. Drag more icons or shapes onto the board. Shapes include databases, servers, users, queues, mail, alerts and scheduled jobs.
- Adjust the zones. Zones are rounded rectangles with a fill colour. Resize them to fit, pick another colour from the selection bar, and press [ to send a zone behind the components.
- Export or share. Save the diagram as a PNG with the camera button, download the project as JSON with Export, or copy a link with Share.