MLOps training and deployment pipeline architecture diagram
MLOps applies the habits of software delivery to machine learning: versioned code and data, automated training, a single place where approved models live, and monitoring once a model is in production.
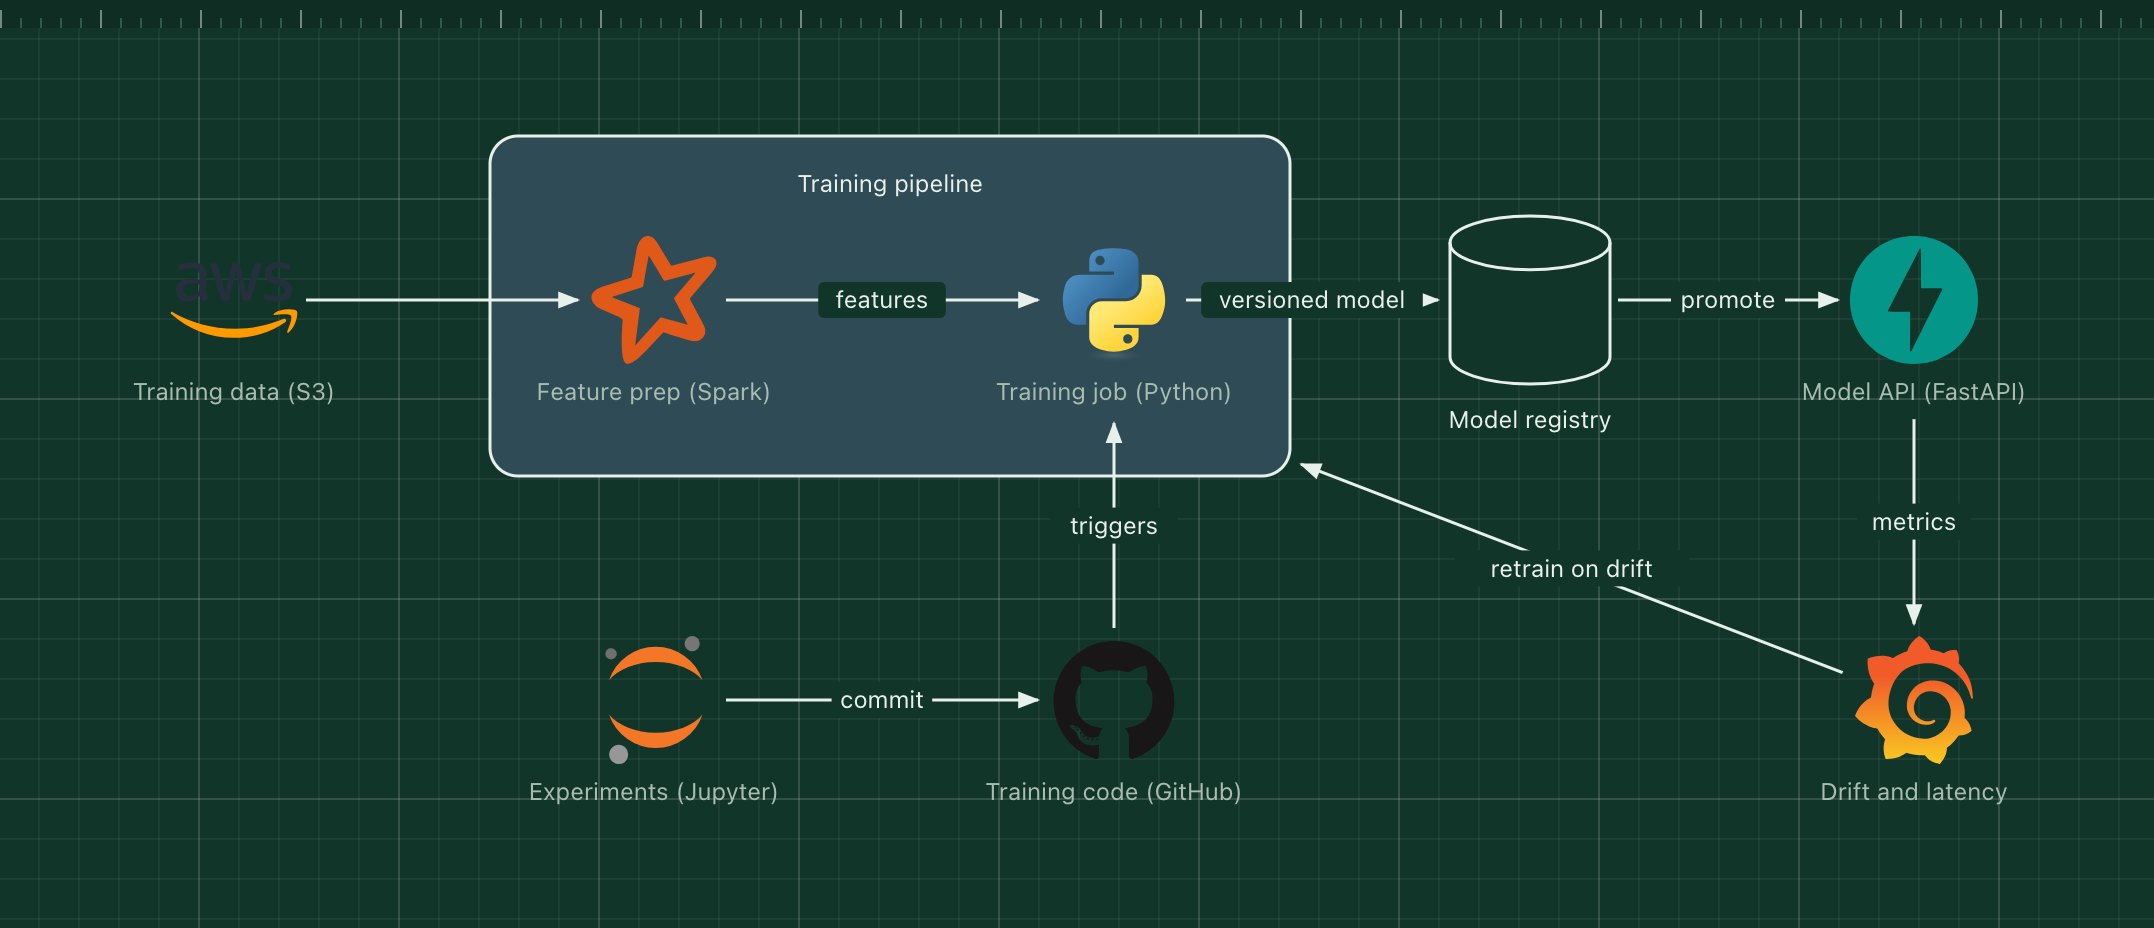
This template shows a batch training pipeline that feeds a model registry, an HTTP model service, and a feedback loop that triggers retraining when live data drifts away from the training data.
What's in the diagram
- Training data (S3)
- Raw and labelled data, stored with dates or versions so any model can be traced back to its inputs.
- Feature prep (Spark)
- Cleans the data and computes features the same way for training and for serving.
- Training job (Python)
- Trains and evaluates the model, usually in a container on GPU nodes.
- Model registry
- Stores each trained model with its metrics, data version and code commit, and marks which one is in production.
- Model API (FastAPI)
- Loads the promoted model and serves predictions over HTTP.
- Drift and latency (Grafana)
- Compares live inputs and predictions with training data, and watches response times.
How a request flows through it
- A data scientist explores in a notebook and commits the training code to GitHub.
- The commit, or a schedule, starts the pipeline: Spark builds features from the latest data.
- The training job fits the model, evaluates it and saves it to the registry with its metrics.
- After review, the model is promoted, and the model API loads the new version.
- Monitoring tracks drift; when it crosses a threshold, it triggers a new training run.
When to use this architecture
Use it once a model is used in production and needs to be retrained regularly or audited. For a one-off analysis, a notebook is enough; the pipeline pays off when several people train models or when you must explain which data produced which prediction.
Ways to adapt the template
- Use a managed registry and tracking service such as MLflow.
- Serve with a model server and autoscaling on Kubernetes.
- Add a shadow deployment that scores live traffic before promotion.
- Add a feature store when several models share features.
How to customise this diagram
- Open your copy. Click Open in the editor. The template opens as your own project, saved in your browser. Nothing is uploaded.
- Rename the parts. Double-click any label, such as “Training data (S3)”, type your own name, then click outside it. Arrow labels work the same way.
- Swap a technology. Select Training data (S3) and press Delete. Search the icon palette for the technology you use, drag it onto the board, and reconnect it by dragging its arrow handle onto the next component.
- Add what is missing. Drag more icons or shapes onto the board. Shapes include databases, servers, users, queues, mail, alerts and scheduled jobs.
- Adjust the zones. Zones are rounded rectangles with a fill colour. Resize them to fit, pick another colour from the selection bar, and press [ to send a zone behind the components.
- Export or share. Save the diagram as a PNG with the camera button, download the project as JSON with Export, or copy a link with Share.