How to diagram AI systems: RAG, agents and MLOps
AI systems add new boxes and new risks. Here is what their diagrams need to show.
AI features have quietly become one of the most common things engineers draw. A RAG chatbot, an agent that calls internal tools, a model trained on company data: each adds components that classic diagrams do not have, such as vector stores, model APIs, evaluation loops, and a new kind of risk around what data goes where.
We added three AI templates to ArchBoard. Here is what we learned about drawing these systems clearly.
Separate the online path from the offline path#
Almost every AI system has two halves that run on different schedules:
- Online: a user request that must answer in seconds, such as a question, a chat turn or a prediction.
- Offline: work that prepares for those requests, such as ingesting and embedding documents, training a model, or running evaluations.
Mixing them on one line of boxes is the most common mistake. Put the online path across the top, left to right, and the offline pipeline underneath in its own zone. Readers immediately see what is latency-critical and what is batch.
Treat the model as an external dependency#
Whether you call a hosted LLM API or run your own model server, draw it as its own box, outside your core services, with the arrow labelled with what you send: "prompt + retrieved context", "embedding request". Three reasons:
- Cost and latency concentrate there, so reviewers will ask about it first.
- Data leaves your system at that arrow when the model is hosted elsewhere. Make it visible.
- It changes. Model providers and versions change more often than the rest of the architecture.
RAG: show retrieval explicitly#
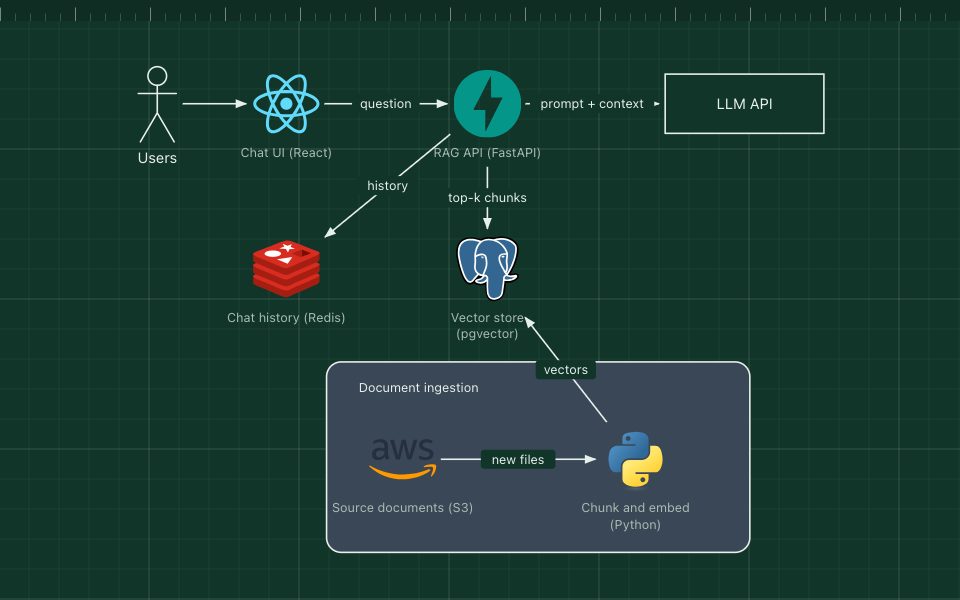
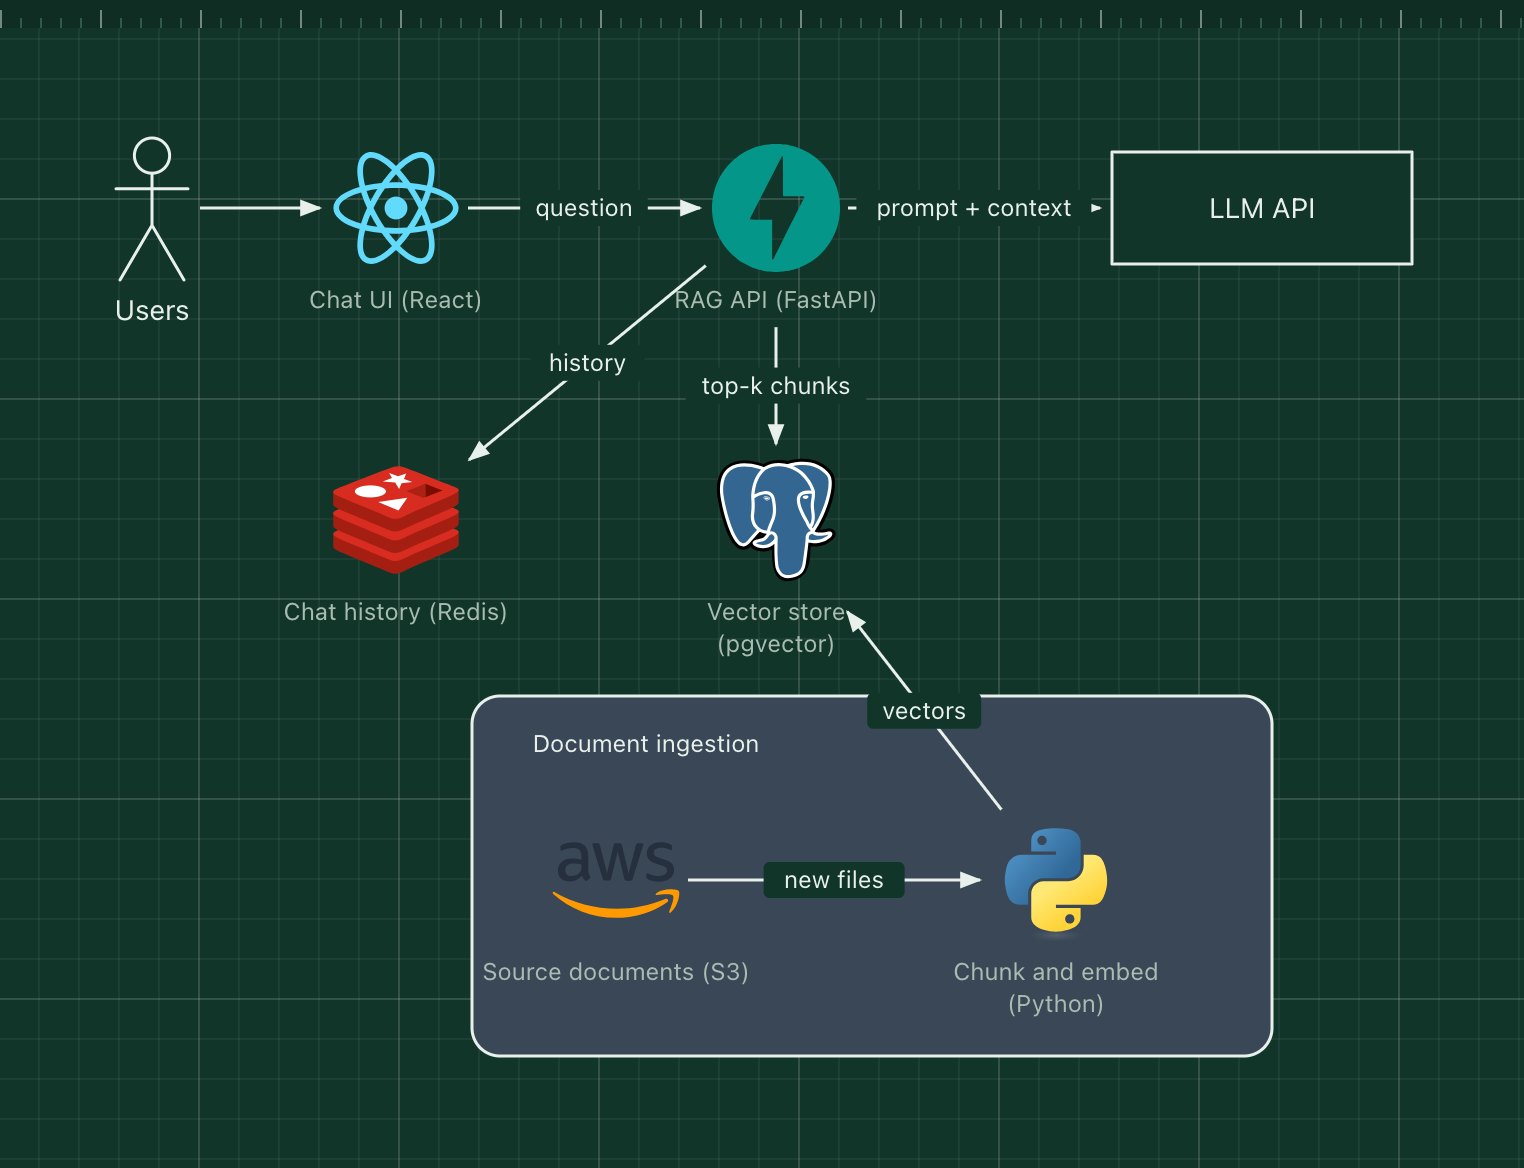
A retrieval-augmented generation (RAG) system answers from your own documents. The diagram should make the retrieval step impossible to miss:
- The vector store as its own data store, labelled with what it holds: "embeddings of product docs".
- The query path: question, then embedding, then nearest chunks, then prompt, then answer.
- The ingestion path: documents, then chunking, then embeddings, then the vector store, with its schedule ("on change", "nightly").
If answers are cached or chat history is stored, show those stores too. They matter for privacy reviews.
Agents: draw the loop and fence the tools#
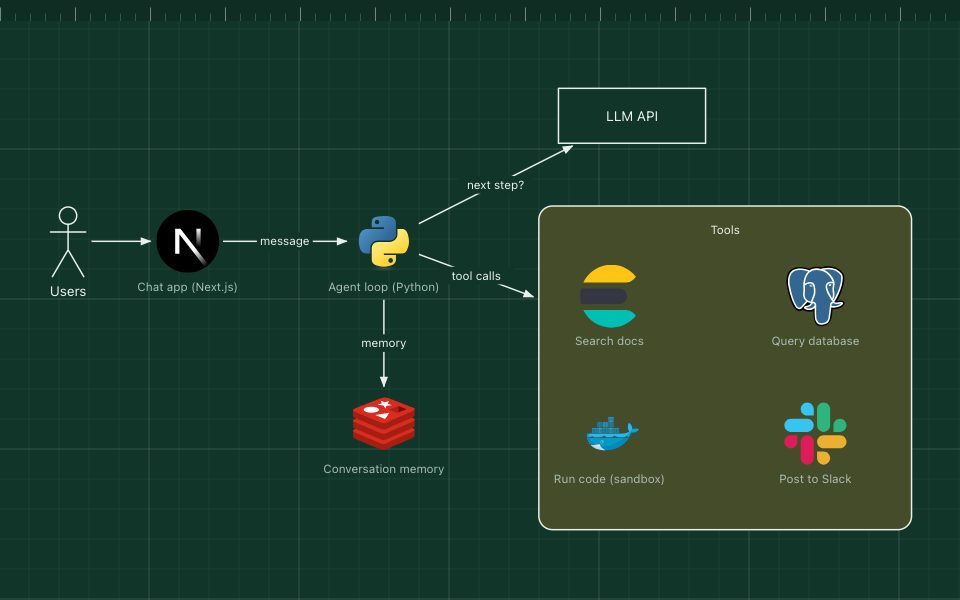
An agent calls a model repeatedly, and the model decides which tool to use next. Two things make an agent diagram useful:
- The loop. One arrow from the agent to the model labelled "next step?", and one from the agent to its tools. Do not draw every possible tool sequence: the point of an agent is that the sequence is decided at run time.
- A boundary around the tools. Put every tool inside one zone and label what each can do: read-only search, database queries, sending messages. That zone is where security review focuses, so make it easy to find.
Note which tools can change things, such as sending email or writing data, and whether a human approves those calls. It is the question every reviewer asks.
MLOps: make the feedback loop visible#
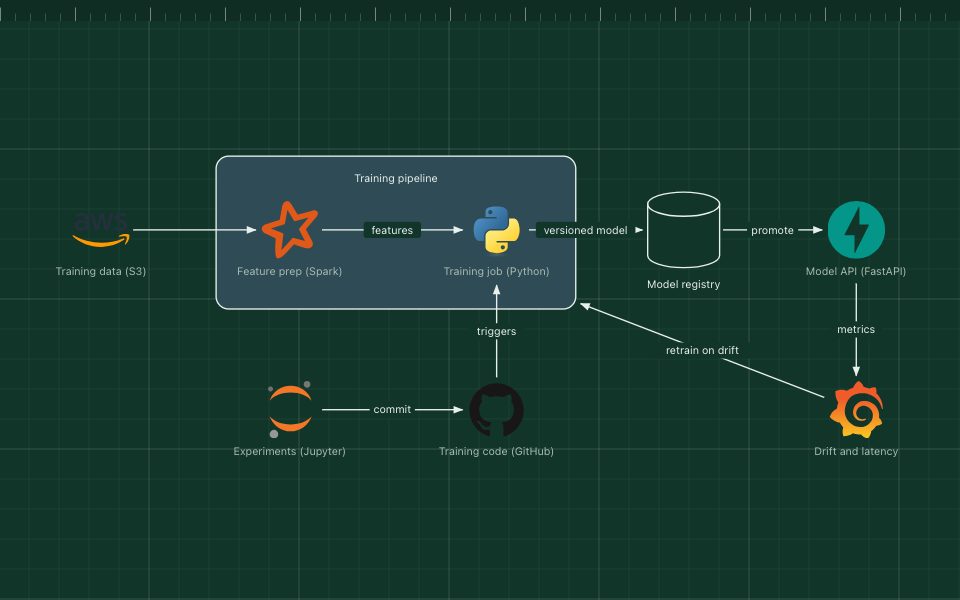
For systems that train their own models, the important story is the cycle:
- Data is prepared into features.
- A training job produces a model.
- The model is stored in a registry with its metrics and data version.
- The approved model is served.
- Monitoring watches for drift, and drift triggers retraining.
Draw the cycle as a loop, with the "retrain on drift" arrow going back to the training pipeline. Without it, the diagram reads as a one-off pipeline, which is exactly the misunderstanding that leads to stale models in production.
Label the data boundaries#
AI diagrams are increasingly read by security and legal teams, not only engineers. Help them by marking:
- Where personal or confidential data enters the system.
- Which arrows leave your network: calls to hosted models, embedding APIs, external tools.
- What is stored, and where: prompts, answers, embeddings, logs.
A small key such as "orange zone: leaves our infrastructure" can save a long meeting.
A short checklist for AI diagrams#
- Online request path and offline pipelines in separate zones.
- The model as its own box, with what you send it on the arrow.
- Vector stores, caches and logs drawn as data stores, with what they hold.
- For agents: the loop, plus a fenced zone of tools with their permissions.
- For MLOps: the full cycle, including the retraining arrow.
- Data boundaries marked for reviewers.
All three systems in this post are free templates. Open them in the editor, replace the components with your own model, store and tools, and you have a diagram ready for your next design review.