How to draw a microservices architecture diagram
Show services, who owns which data, and how they talk, without drawing a hairball.
A microservices diagram has a harder job than most architecture diagrams. There are many boxes, each owned by a different team, talking to each other in different ways, and the interesting failures happen between them. Drawn carelessly, it turns into a hairball that nobody can follow.
This guide shows how to draw one that people can actually use: for onboarding, for design reviews and for incident calls.
Decide what the diagram is for#
Before drawing anything, pick one of these questions. Each needs a different diagram:
| Question | What to draw |
|---|---|
| What services exist and who owns them? | Services grouped by team, with their data stores |
| How does a request travel through the system? | One request path, step by step |
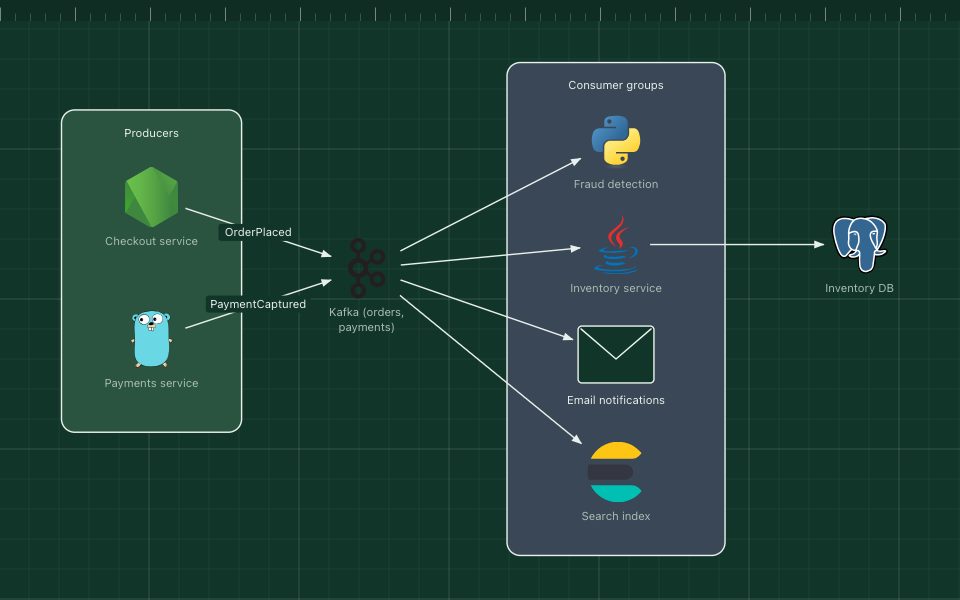
| What happens when an event is published? | Producers, the event stream and every consumer |
| Where does each service run? | Clusters, namespaces and regions (a deployment view) |
Trying to answer all four on one canvas is the main cause of unreadable microservices diagrams.
Start at the edge#
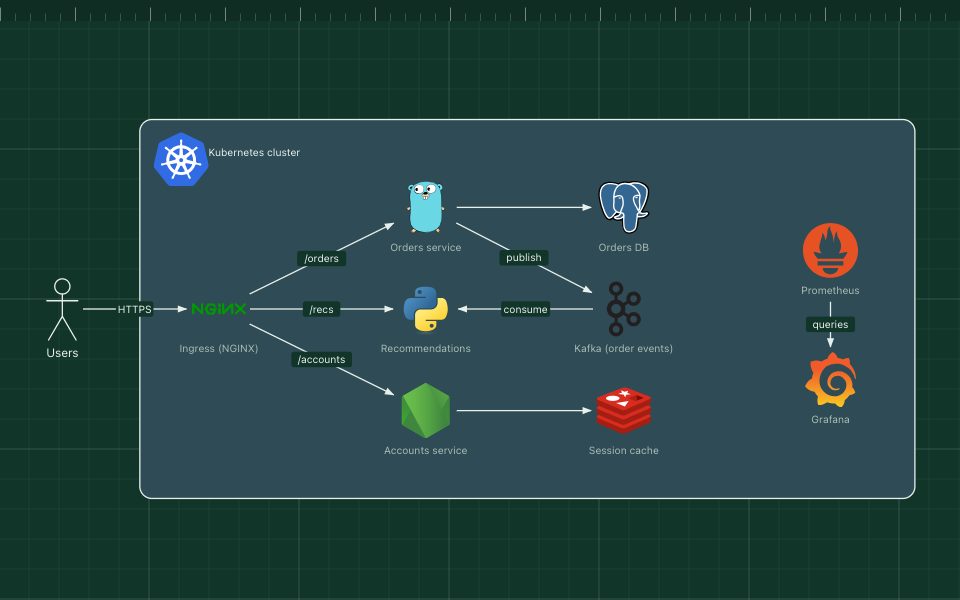
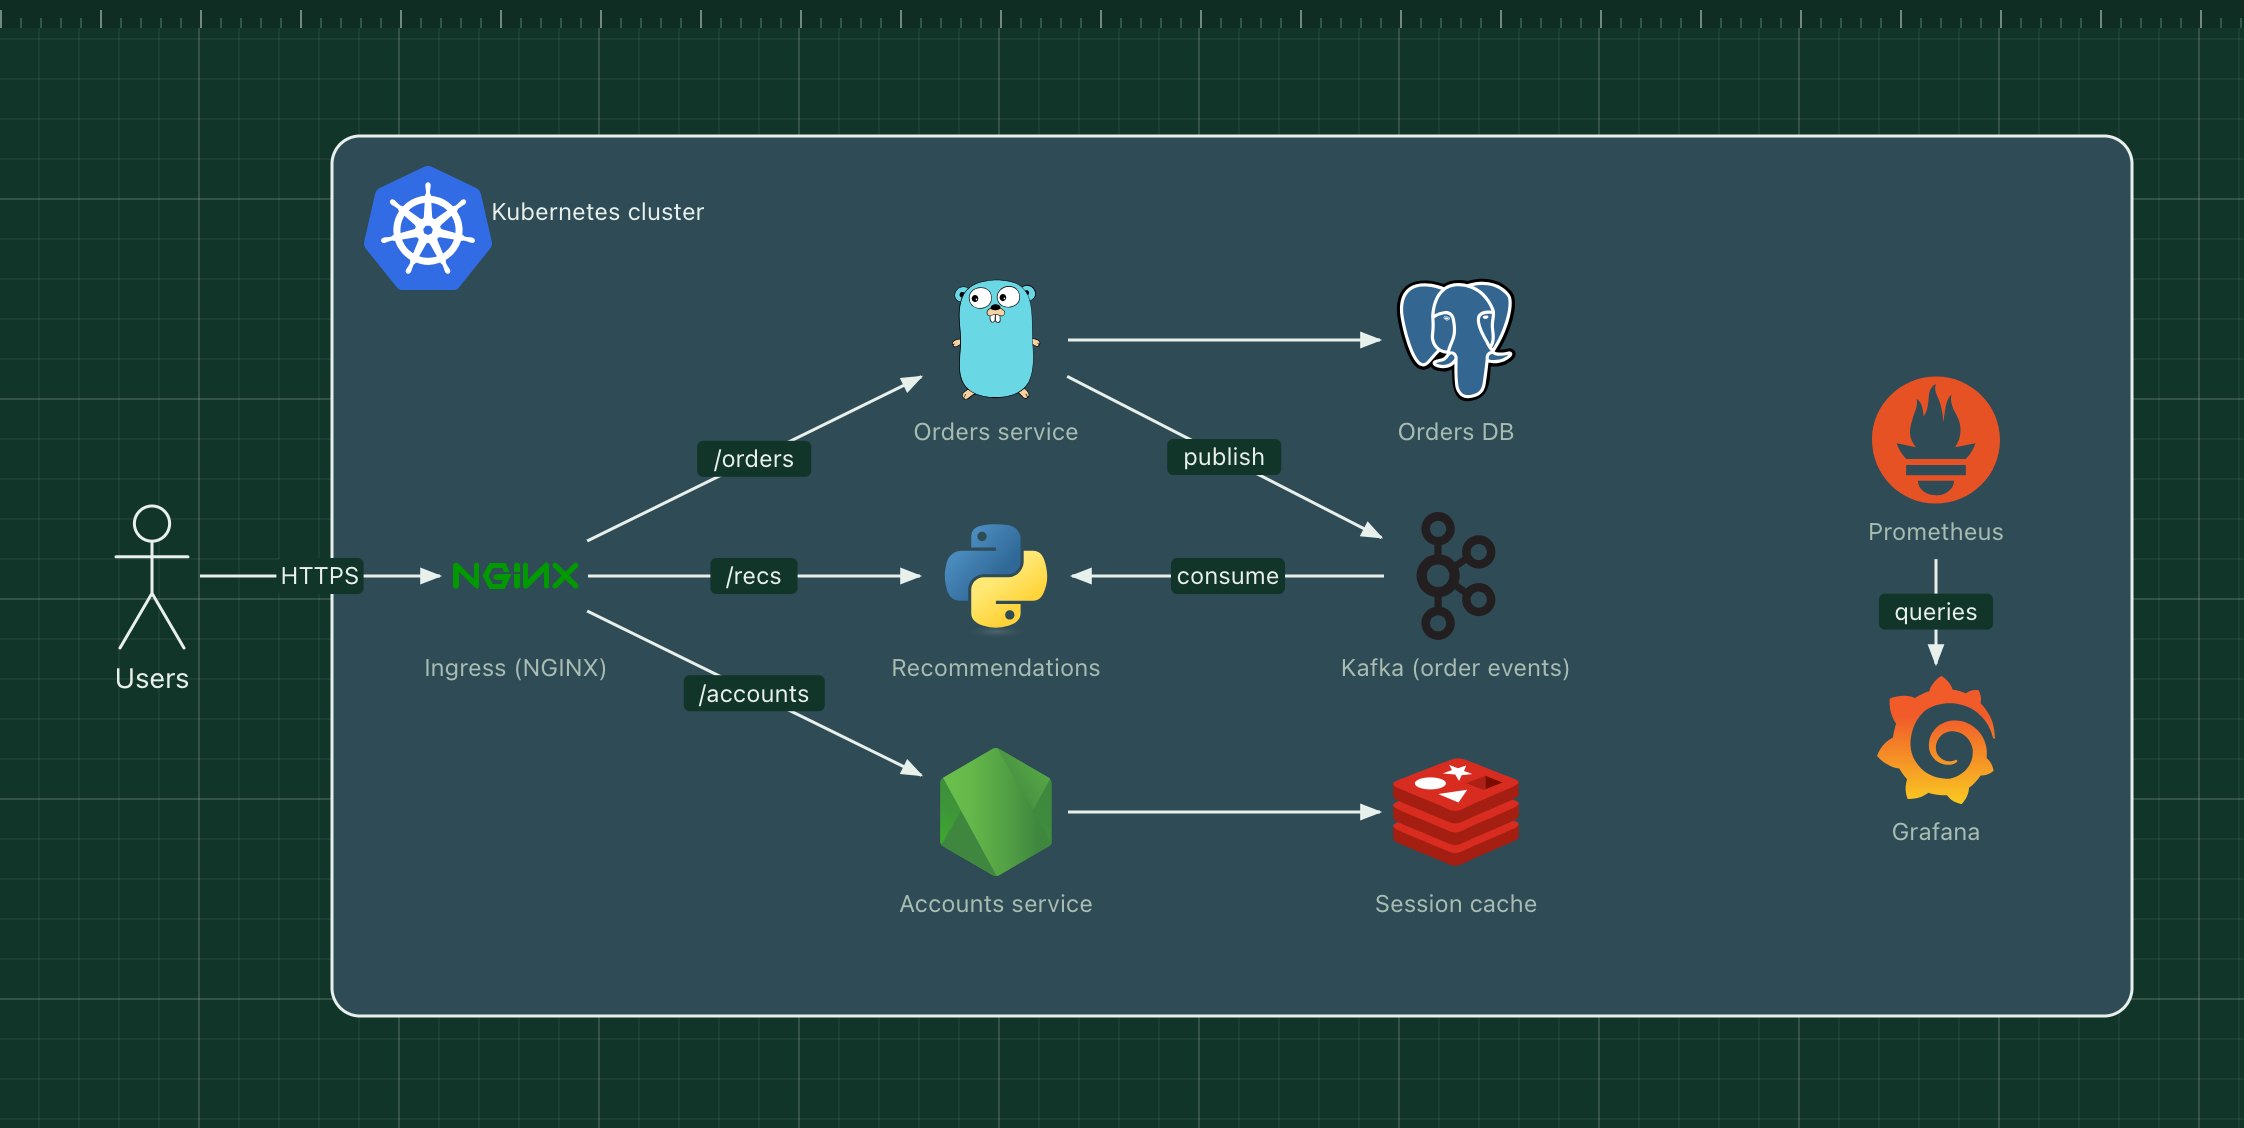
Begin where traffic enters: users, then the CDN, load balancer, API gateway or ingress. Everything else hangs off that entry point. Readers follow a diagram the way requests flow, so put the edge on the left and let the system unfold to the right.
One box per service, with its data#
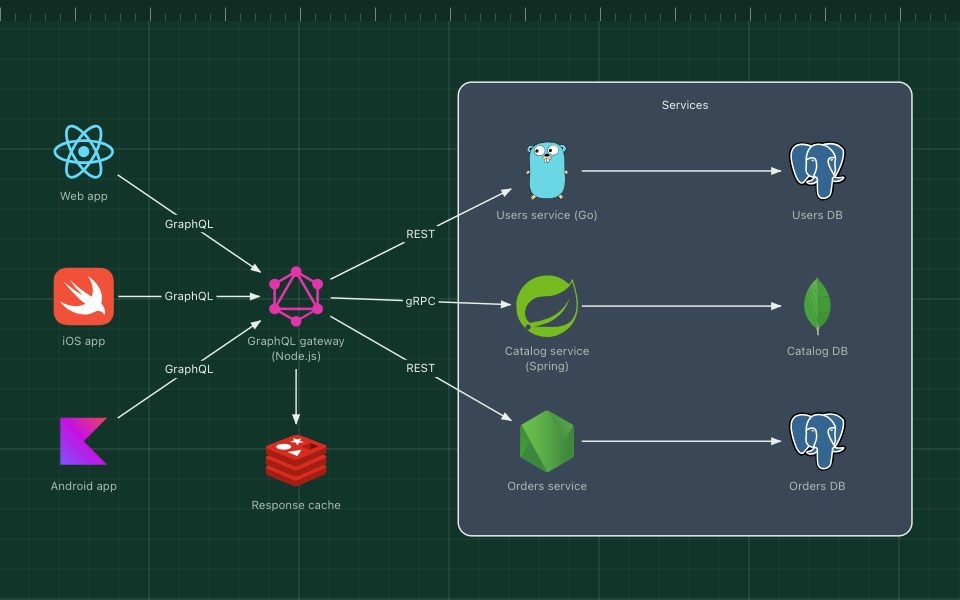
Draw each service once, with its name and language or framework: "Orders service (Go)". Then draw the service's own database next to it.
Showing data ownership is the single most useful thing a microservices diagram can do. If two services connect to the same database, the diagram should make that obvious, because it is usually a design problem worth discussing.
- One cylinder per data store, placed next to the service that owns it.
- Shared infrastructure, such as a cache cluster or a message broker, gets its own box in the middle.
- Scaled services are drawn once. Write "×3" or "autoscaled" rather than drawing three copies.
Show sync and async calls differently#
Services talk in two very different ways, and the diagram should show which is which:
- Synchronous calls (HTTP, gRPC): the caller waits for an answer. Draw a direct arrow, labelled with the endpoint or method: "GET /orders", "gRPC".
- Asynchronous messages (Kafka, RabbitMQ, SQS): the producer does not wait. Draw an arrow to the broker, and from the broker to each consumer, labelled with the event or topic: "OrderPlaced".
This distinction matters during incidents. A slow synchronous dependency slows everyone upstream; a slow consumer only builds up a queue.
Group by team or domain#
Zones are what turn twenty services into something readable. Group services by the boundary that matters to your readers:
- Business domain: checkout, catalogue, accounts.
- Owning team: useful for "who do I page?" diagrams.
- Runtime: Kubernetes namespaces or clusters, for a deployment view.
Give each zone a title and use colour consistently across all your diagrams.
Show the gateway and cross-cutting parts once#
Most systems have pieces that every service uses: an API gateway, authentication, a service mesh, logging and metrics. Drawing an arrow from every service to each of them buries the interesting connections.
Instead, draw them once and say how they apply: a zone labelled "All services emit metrics to Prometheus", or a single gateway in front of everything.
Split before it becomes a hairball#
When a diagram passes about 15 to 20 services, split it:
- A landscape view: every service as a small box, grouped by domain, with only the most important connections.
- One view per domain: the services in that domain, their data and their dependencies in full.
- One view per important flow: for example "placing an order", showing only the services involved, in order.
Link the views to each other in your documentation, so readers can zoom in.
Event-driven systems#
If your services mostly communicate through events, put the event broker at the centre of the diagram, producers on the left and consumers on the right. It makes it easy to answer "who reacts to this event?", the question most people bring to an event-driven diagram.
A checklist#
- One question per diagram.
- Traffic enters on the left.
- Each service drawn once, with its language and its own data store.
- Sync calls and async events visibly different, all labelled.
- Services grouped into titled zones by domain, team or runtime.
- Cross-cutting infrastructure drawn once.
- Split into landscape, domain and flow views past about 20 services.
Every template above opens in the ArchBoard editor as your own copy. Replace the services with yours and you have a diagram that follows all seven rules.