System design diagrams for interviews and design docs
A repeatable way to draw a system design, from the first box to the scaling story.
Whether you are in a system design interview or writing a design document at work, the diagram does the same job: it shows that you understood the problem, chose a sensible structure, and know where it will break first.
This guide gives you a repeatable way to draw one, in the order interviewers and reviewers expect to see it.
1. Write the requirements next to the diagram#
Before the first box, note what the system must do and at what scale. A few lines are enough:
- Functional: "Users send messages to rooms; members see them within a second."
- Scale: "1 million daily users, 50,000 concurrent connections, 2,000 messages per second at peak."
- Constraints: "Messages must not be lost; history kept for a year."
These numbers decide the design. A diagram without them invites the question "why did you need Kafka?", and you will want the answer written down.
2. Draw the simplest version that works#
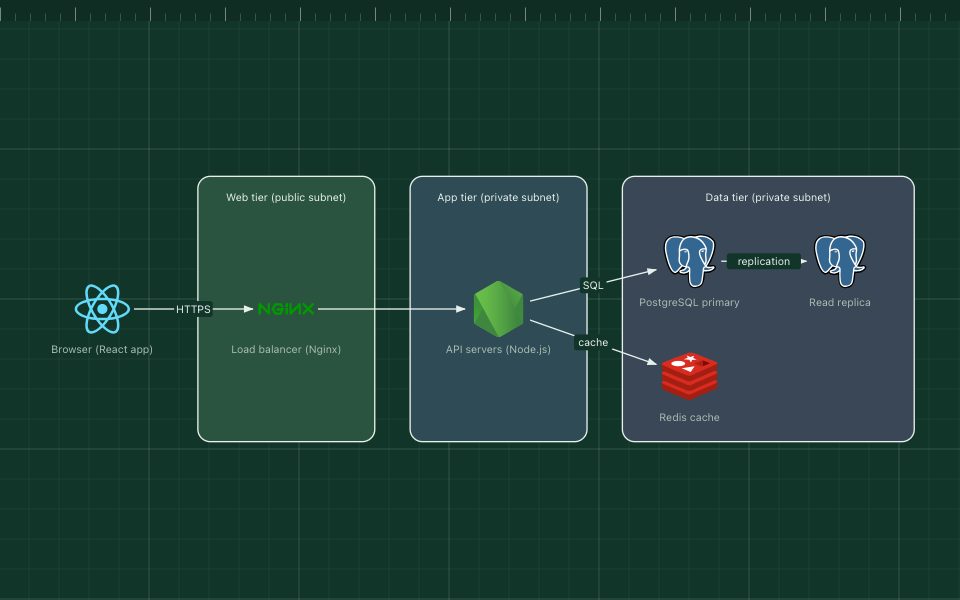
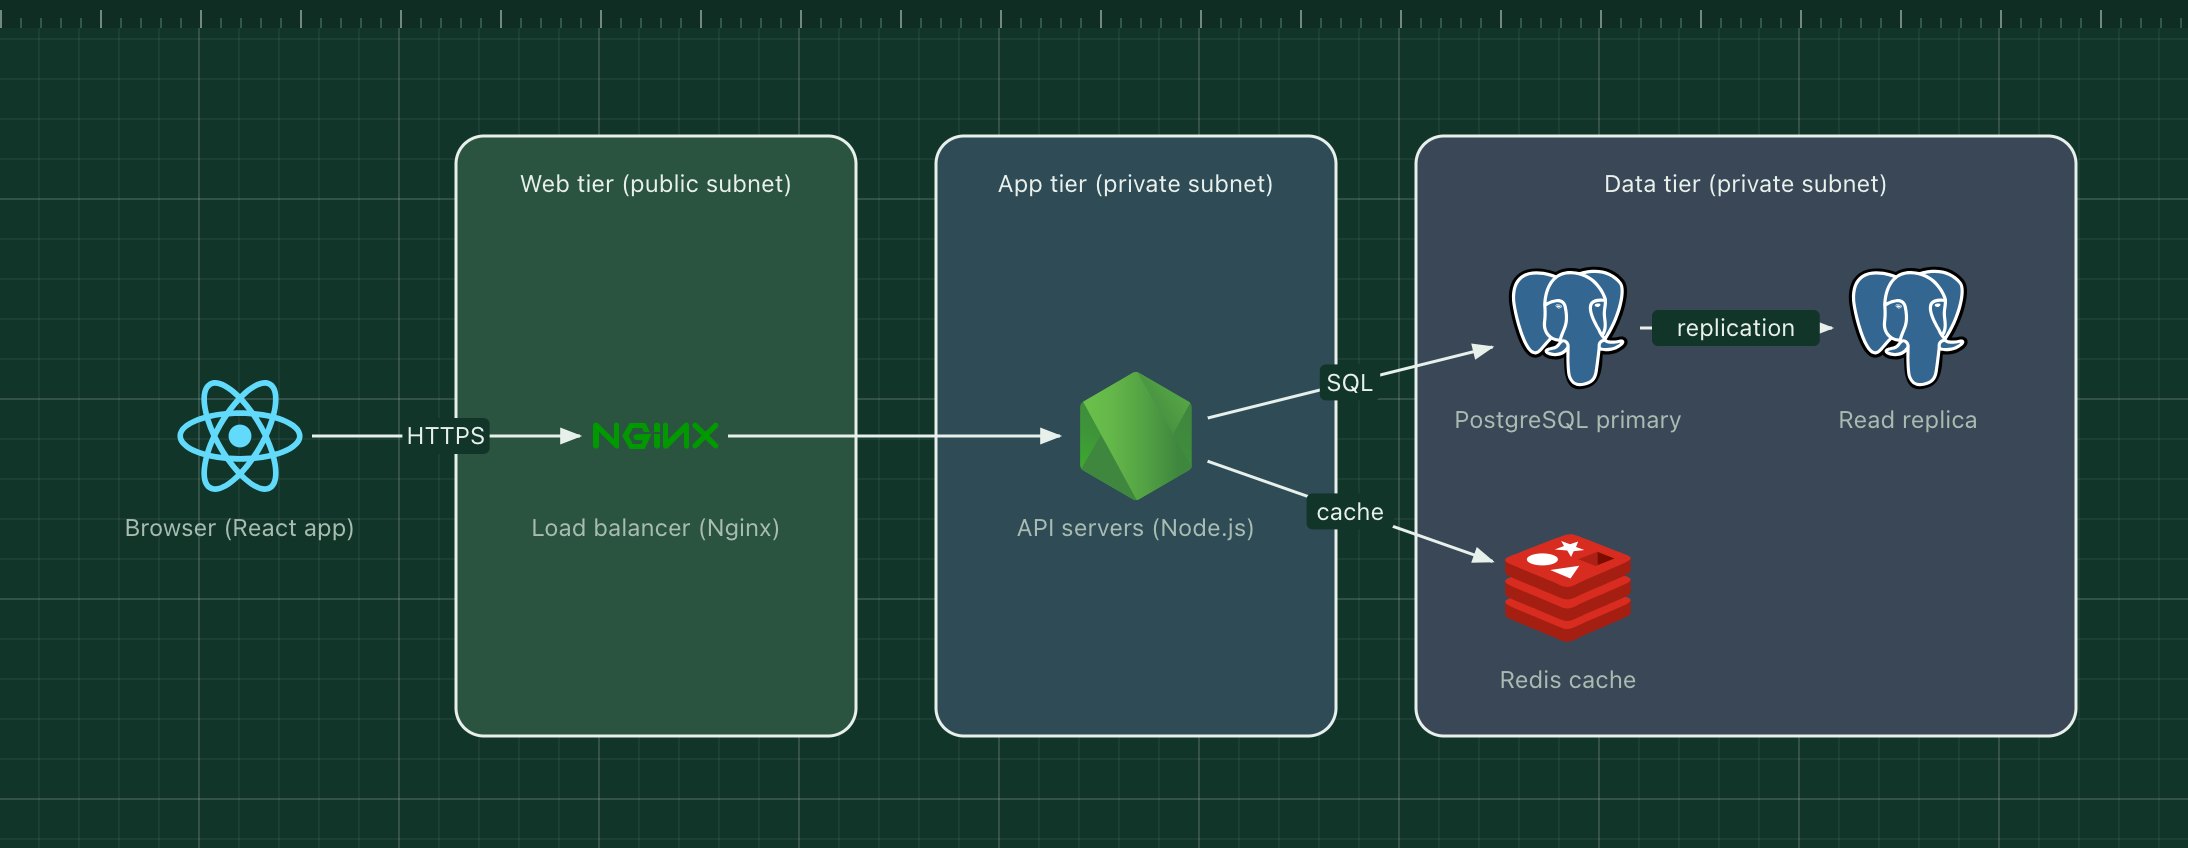
Start with the smallest design that meets the functional requirements: a client, one service, one database. It is almost always a three-tier shape, and that is fine. It gives you and the reader a shared starting point.
Resist adding queues and caches yet. Each one should arrive later, in response to a specific problem you can name.
3. Follow one request end to end#
Walk through the main use case and make sure every step has a box and an arrow:
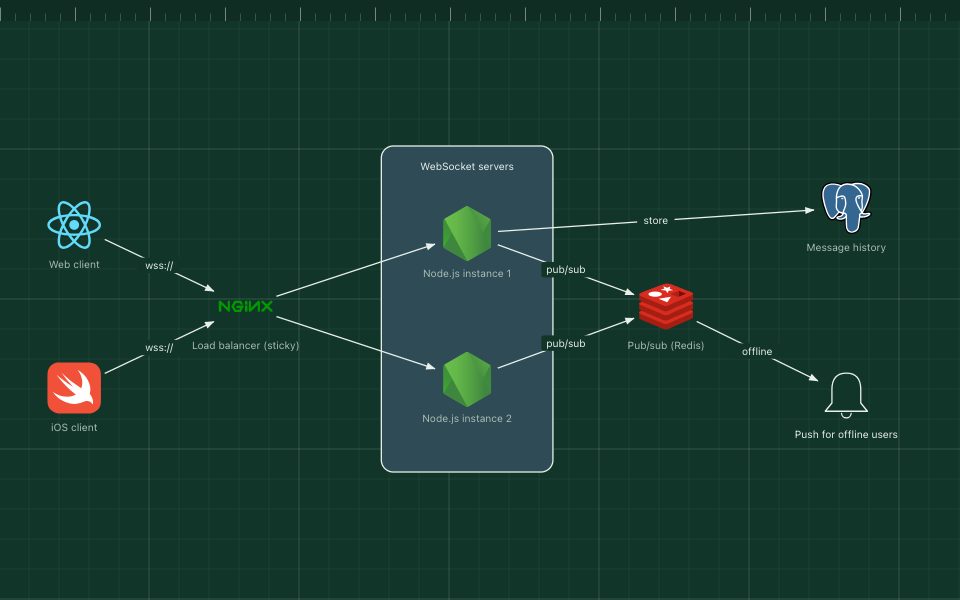
- The client sends the request. Over what protocol: HTTPS, WebSocket, gRPC?
- What receives it: a load balancer, an API gateway, a CDN?
- Which service handles it, and what does it read or write?
- What is returned, and what happens in the background afterwards?
Label the arrows with what flows: "POST /messages", "write message", "fan out to room". In an interview, narrating this walk-through while you draw is the most convincing thing you can do.
4. Show where the data lives#
Reviewers spend most of their questions on data, so make it easy to see:
- Each database as a cylinder, with its type: PostgreSQL, Cassandra, Redis, S3.
- What it stores and roughly how much: "messages, ~2 TB a year".
- How it is partitioned or replicated, if that matters at your scale.
Choosing the store is a trade-off between consistency, query patterns and volume. Write the reason next to the box: "Cassandra: write-heavy, queried by room and time".
5. Scale the bottleneck, and show the change#
Now use the numbers from step 1. Find the first part that breaks under load and fix just that, adding the new components to the diagram:
| Problem | Typical addition |
|---|---|
| Too many reads on the database | Cache (Redis) or read replicas |
| Slow work in the request path | Queue and background workers |
| Too many concurrent connections | More stateless servers behind the load balancer |
| Users far from the servers | CDN, or a second region |
| One database too large | Partitioning (sharding) by a key |
Draw each addition where it sits in the request path, and label why it is there. A diagram that shows the evolution, from simple to scaled, tells a much better story than one that starts with twelve boxes.
6. Mark the failure points#
Strong answers and good design documents say what happens when things break:
- What if a server dies mid-request? (Stateless servers, retries.)
- What if the database primary fails? (Replica promotion, how much data might be lost.)
- What if the queue backs up? (Consumers scale out, alerts fire.)
You do not need a box for every scenario. A short note next to the relevant component, such as "replica promoted on failure, under 30 s", is enough.
7. Keep it readable on one screen#
Interviewers and reviewers read the diagram while listening to you. Help them:
- Main flow left to right, background work below.
- Zones for the client side, the online path and offline processing.
- Real technology names on the boxes, not "DB1" and "Service A".
- Under about 20 boxes. If it grows past that, show an overview plus one zoomed-in view.
Example: a video upload pipeline#
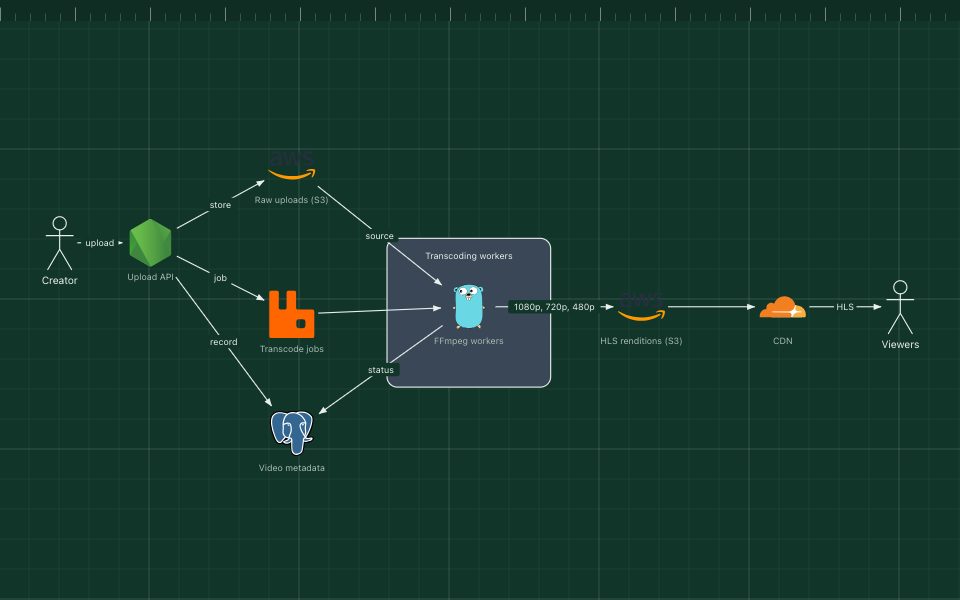
Video platforms are a common interview question because they mix a synchronous path (upload) with heavy asynchronous work (transcoding) and global delivery (CDN). Notice how the diagram separates the three.
Practising#
The best way to get fast at system design diagrams is to redraw known systems from memory: a URL shortener, a chat app, a news feed, a ride-hailing backend. Use a tool that does not get in your way. In ArchBoard you can drag in real technology icons, connect them in seconds, and start from any of the templates above.