Lakehouse architecture
Warehouse-style tables on cheap object storage, used by SQL, BI and ML alike.
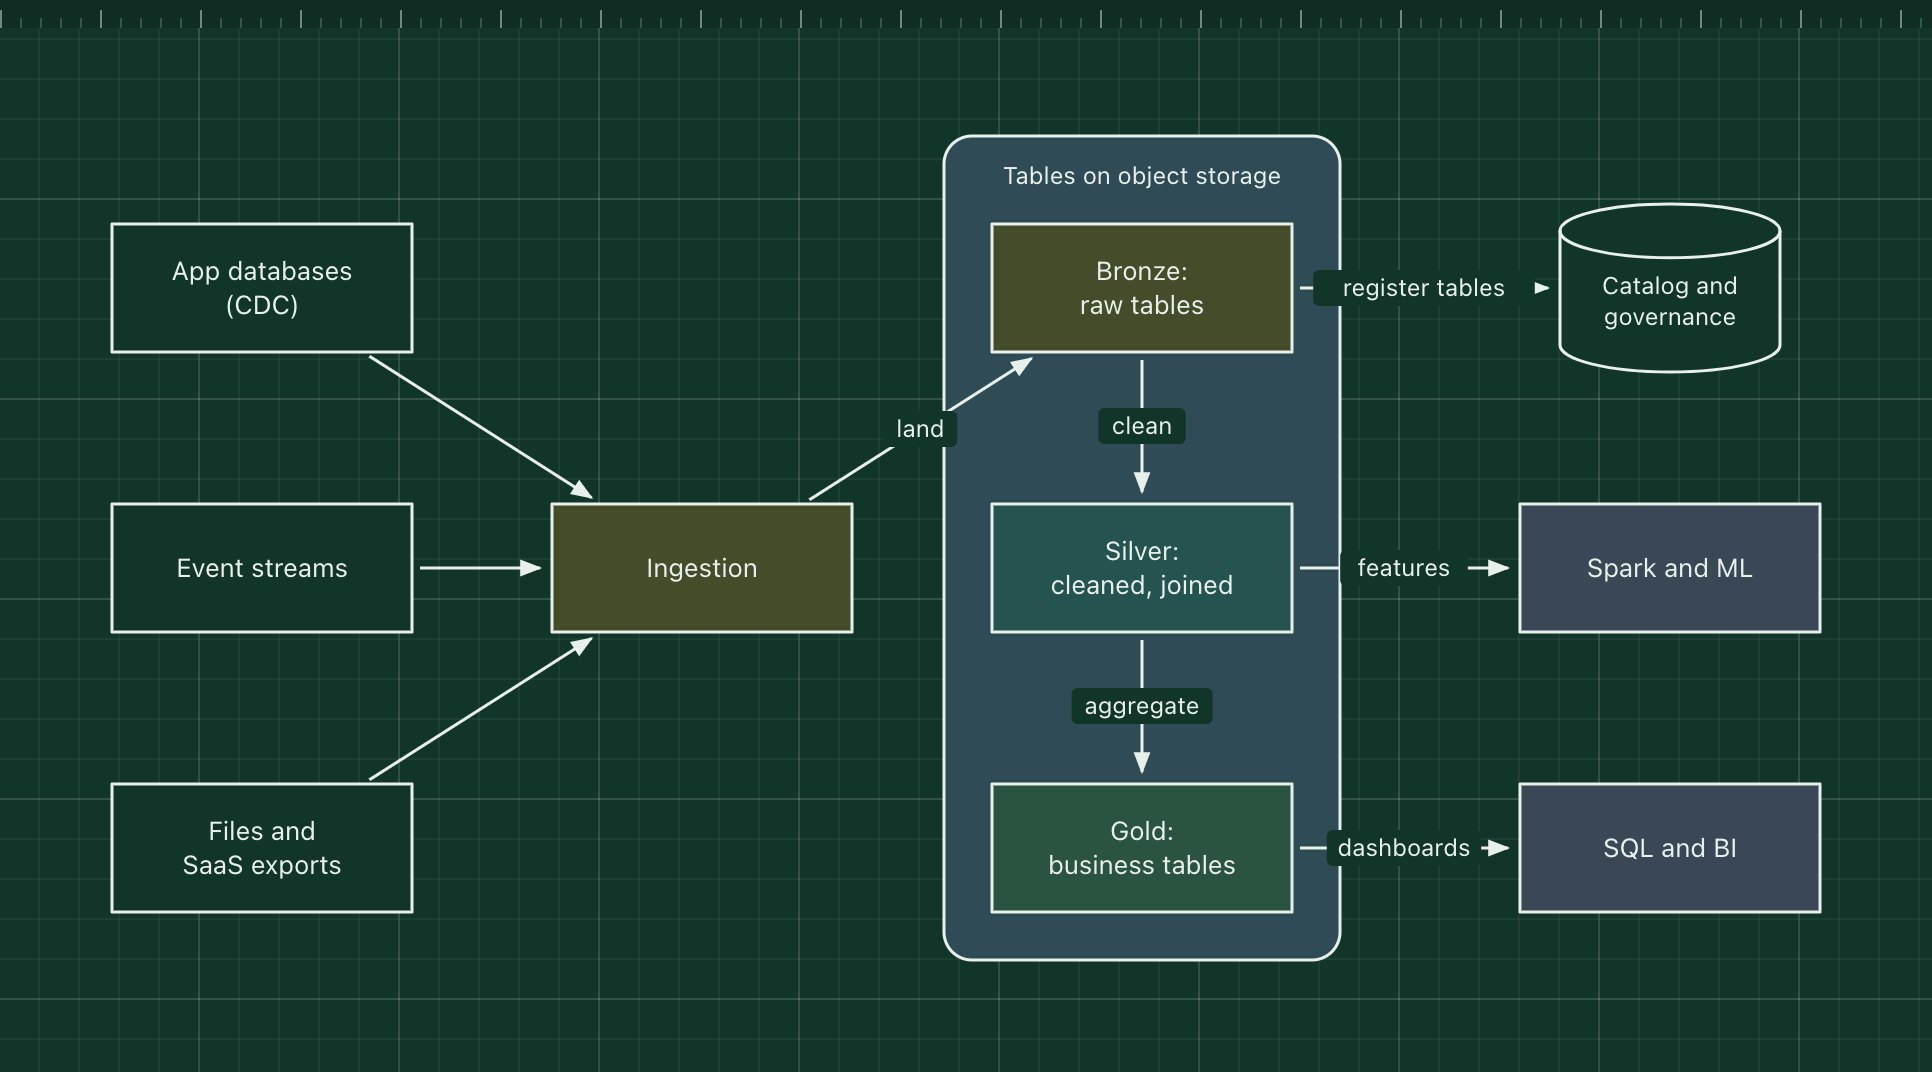
A lakehouse stores data as files in cheap object storage, like a data lake, but adds an open table format (Delta Lake, Apache Iceberg or Apache Hudi) that gives those files warehouse features: ACID transactions, schemas, time travel and fast SQL. One copy of the data then serves BI dashboards, ad hoc SQL, data science and machine learning.
Data usually moves through quality layers, often called the medallion architecture: bronze for raw data as it arrived, silver for cleaned and joined data, gold for business-level tables. Databricks, Snowflake with Iceberg, AWS (S3, Glue, Athena) and Microsoft Fabric all offer lakehouse platforms.
The parts of the pattern
- Sources and ingestion
- Change data capture from application databases, event streams and file drops.
- Bronze tables
- Raw data, kept as it arrived, so you can always reprocess.
- Silver tables
- Cleaned, deduplicated and joined data with enforced schemas.
- Gold tables
- Aggregated, business-ready tables for reporting.
- Engines
- SQL warehouses and BI tools read gold; Spark and ML jobs often read silver.
- Catalog and governance
- One place for table definitions, access rules and lineage.
How it works
- Ingestion lands database changes and events in bronze tables within minutes.
- Scheduled or streaming jobs clean bronze into silver and aggregate silver into gold.
- Analysts query gold tables from BI tools; data scientists train models on silver.
- The catalog controls who can read each table and records where each one came from.
When to use it, and when not to
Good fit
- BI and machine learning need the same data, and you want one copy of it.
- Large or growing data volumes where object storage cost matters.
- You want open formats rather than data locked into one warehouse product.
Think twice
- Small data that fits comfortably in one Postgres or a managed warehouse.
- No one to own table maintenance: compaction, vacuuming and file sizing matter.
- Only BI dashboards, with no data science: a plain warehouse may be simpler.
Edit this diagram
Click Open the diagram in the editor to get your own copy, saved in your browser. Rename the boxes to match your system, swap the generic boxes for technology icons from the palette, then export a PNG, SVG or PDF, or share a link. No sign-up.