Lambda architecture (data)
A batch layer for accurate history plus a speed layer for fresh data, merged at query time.
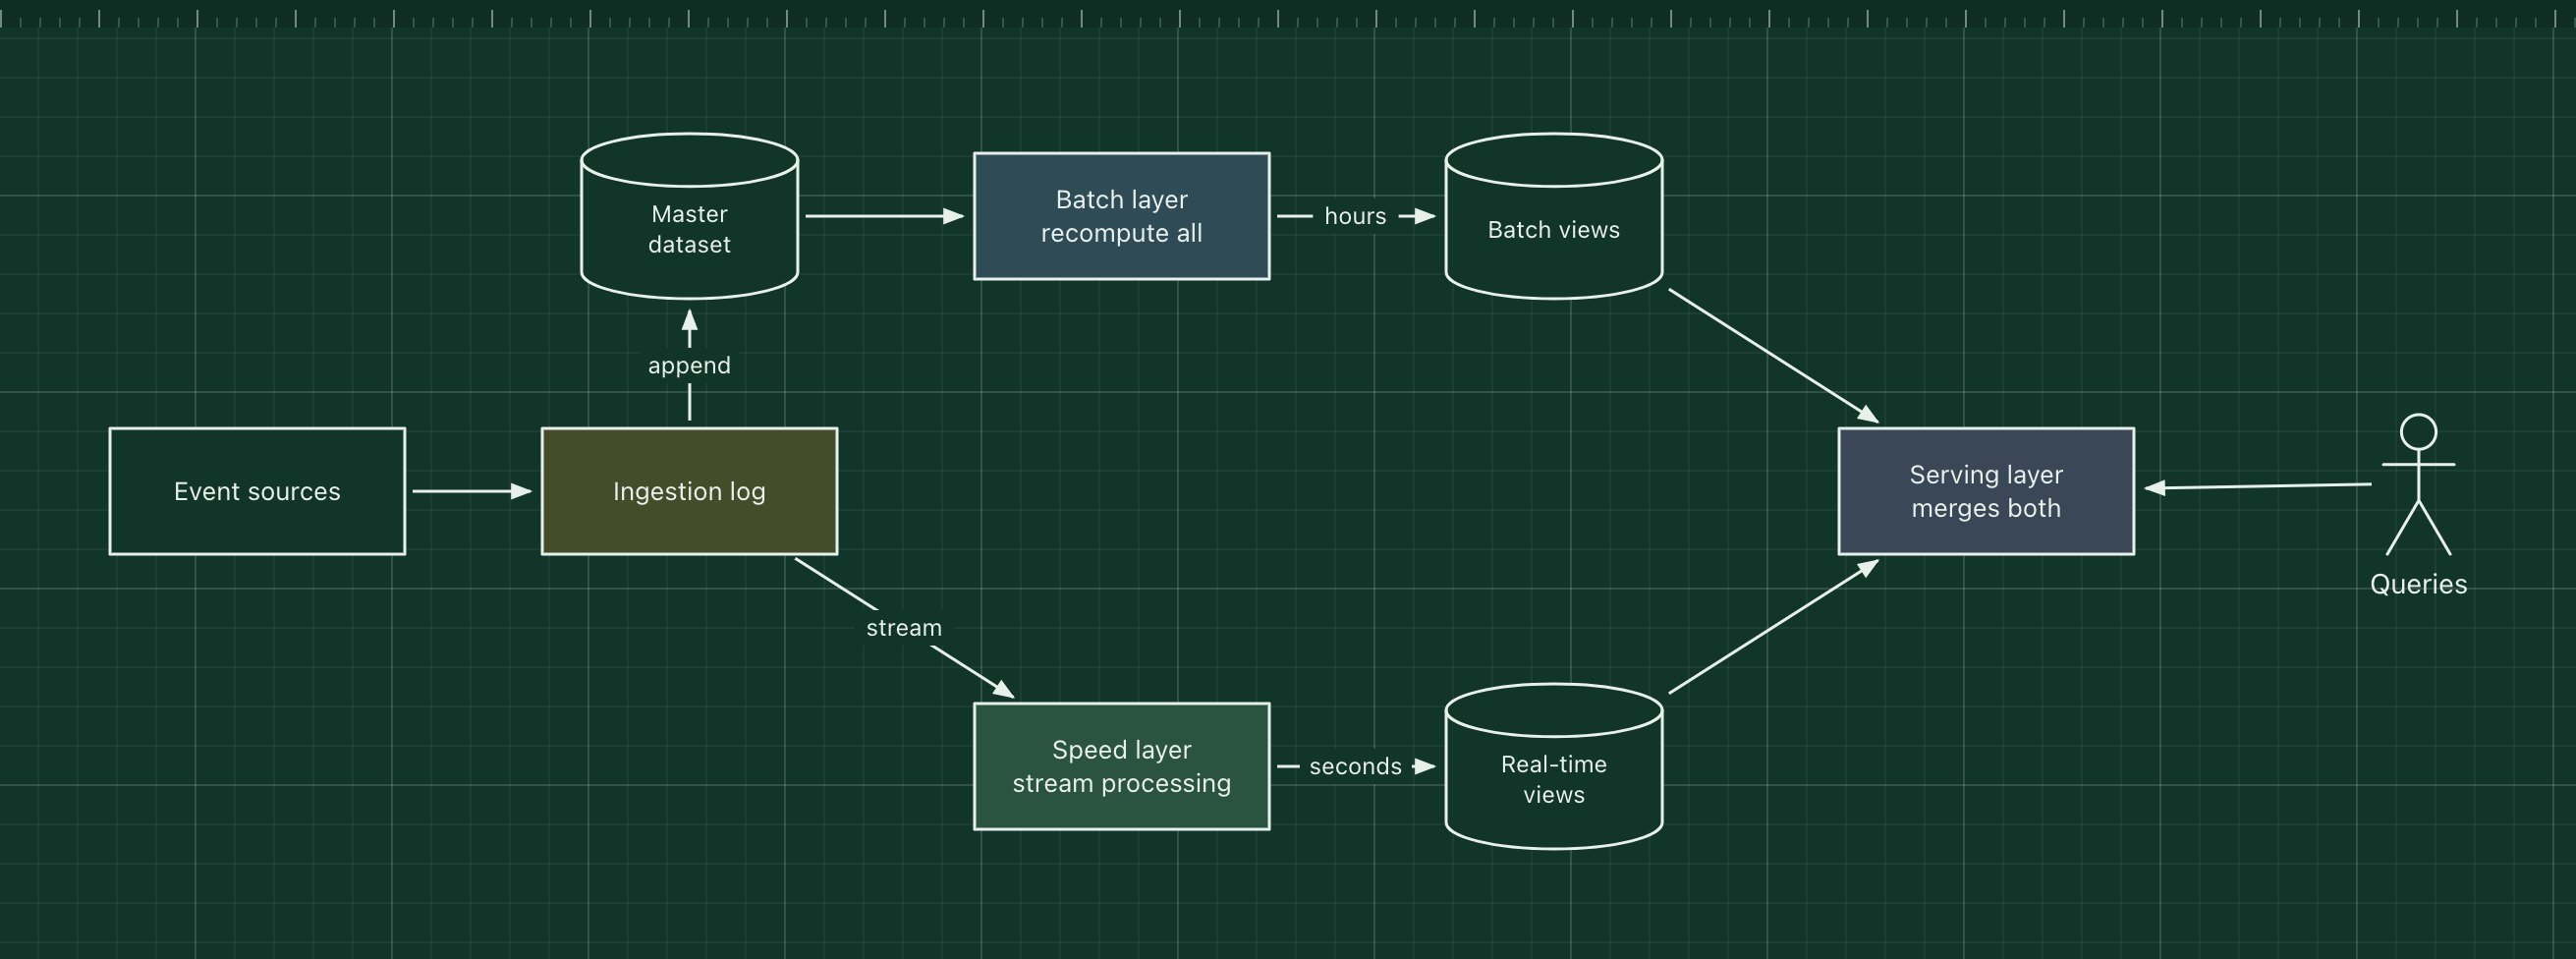
The Lambda architecture, proposed by Nathan Marz, processes the same data twice. A batch layer periodically recomputes complete, accurate views from all of the raw data; a speed layer processes new events as they arrive to cover the hours the last batch run has not reached yet. A serving layer answers queries by merging the two.
It is not related to AWS Lambda. It was the standard answer for big data around 2012 to 2016; many teams have since moved to the Kappa architecture or to lakehouse tables that handle streaming and batch in one system.
The parts of the pattern
- Ingestion log
- A durable stream, such as Kafka, that every event passes through.
- Master dataset
- All raw events, append-only, in cheap storage. The source of truth.
- Batch layer
- Spark or Hadoop jobs that recompute views from the full dataset on a schedule.
- Speed layer
- A stream processor, such as Flink, that updates views for recent data within seconds.
- Serving layer
- Answers queries from both sets of views and combines them.
How it works
- Every event goes into the ingestion log and is appended to the master dataset.
- At the same time, the speed layer updates real-time counts within seconds.
- Every few hours the batch layer recomputes the views from all of the data, correcting any errors.
- A query reads the batch view and adds the real-time view for the period since the last batch run.
When to use it, and when not to
Good fit
- You need both exact historical results and low-latency updates, and the batch tooling already exists.
- Recomputing from raw data is your safety net against bugs in the streaming code.
Think twice
- Maintaining the same logic in two codebases (batch and stream) is too costly: consider Kappa.
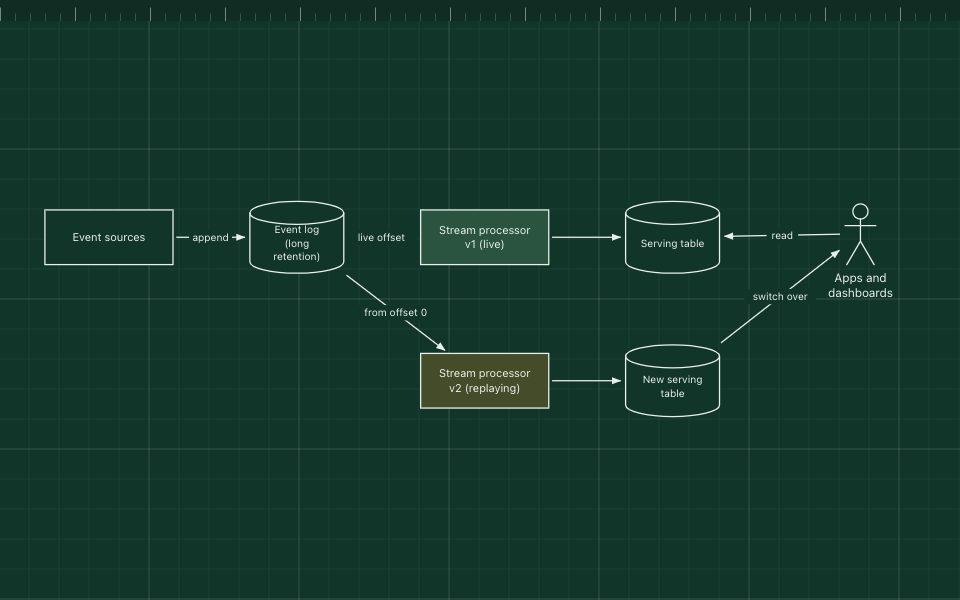
- Your stream processor can already reprocess history from a retained log.
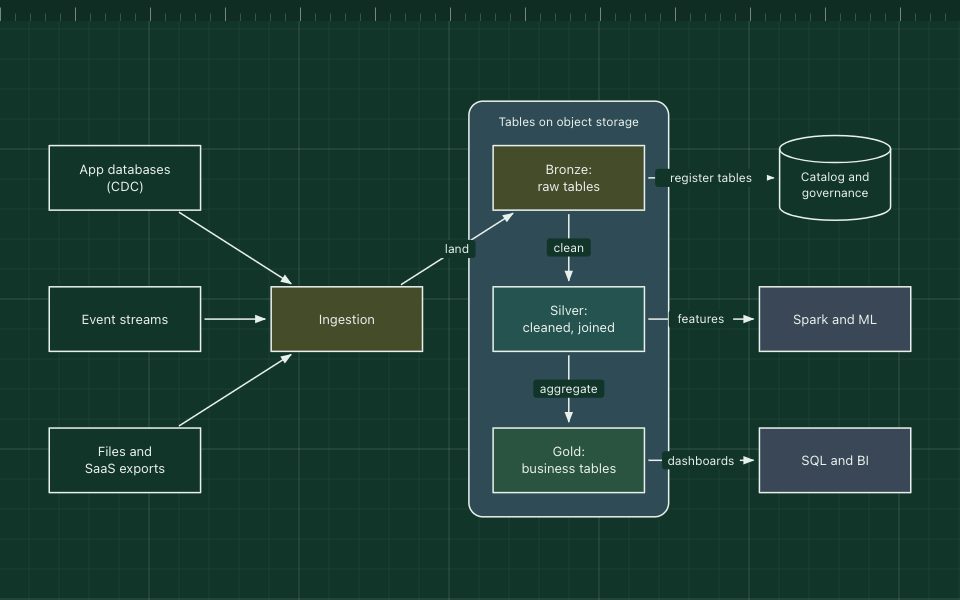
- A lakehouse with streaming tables already gives you both on one copy of the data.
Edit this diagram
Click Open the diagram in the editor to get your own copy, saved in your browser. Rename the boxes to match your system, swap the generic boxes for technology icons from the palette, then export a PNG, SVG or PDF, or share a link. No sign-up.